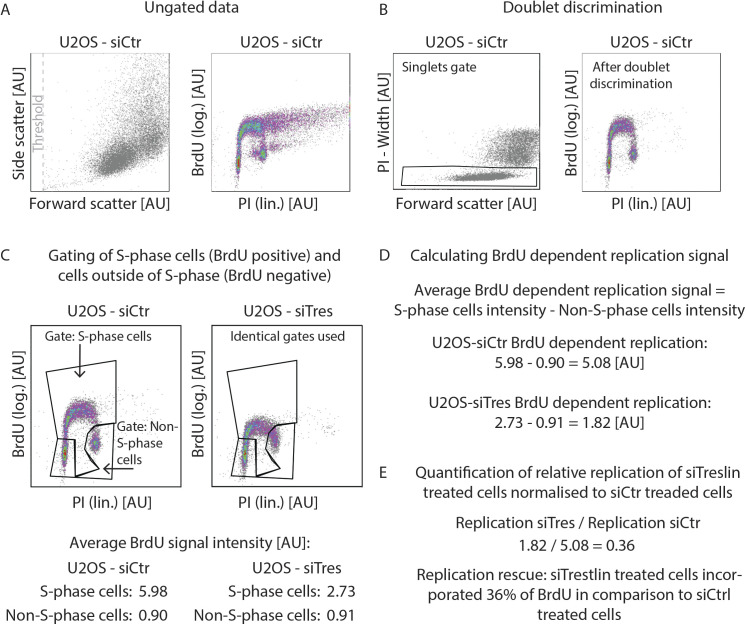
Figure S2. Gating and data processing strategy for BrdU-propidium iodide flow cytometry.
(A) Forward and side scatter plot and BrdU-propidium iodide profiles of ungated data from a sample of U2OS cells treated with siCtr. The indicated threshold was used in the forward scatter channel to eliminate small debris. (B) Strategy used for cell doublet (aggregates of two cells) discrimination of sample shown in (A). (C) Gates used to discriminate between the S-phase (BrdU+) and non–S-phase (BrdU−) cells. Same gates were used within individual experiments. Average BrdU signal intensity was then calculated for each cell population based on the geometric mean of the signal intensities in the BrdU channel. (D) To calculate BrdU-dependent replication signal, the BrdU signal intensity of the S-phase cell population was background-subtracted using the signal intensity of the non–S-phase population. (E) Replication of siTreslin treated cells was normalised to siCtr-treated cells to calculate the relative replication rescue.

