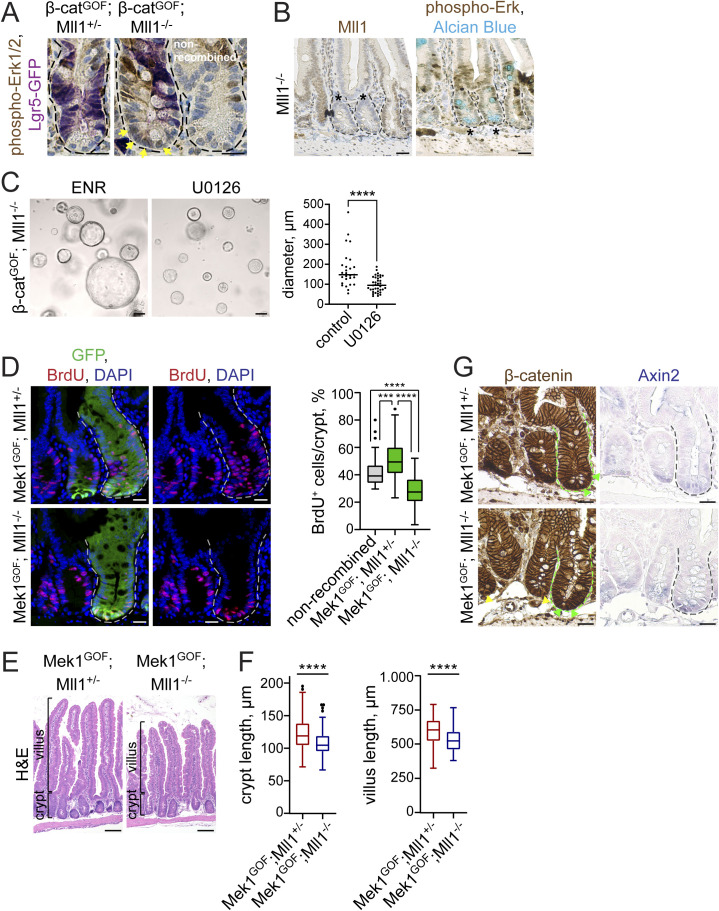
Figure S4. Loss of Mll1 abolishes Mapk-driven crypt proliferation and promotes Mapk-induced goblet cell differentiation.
(A) Immunohistochemistry staining for phospho-Erk1/2 and Lgr5-GFP on sections of β-catGOF; Mll1+/− and β-catGOF; Mll1−/− intestines at 10 d post induction, compared with adjacent non-recombined crypt, nuclei counterstained with haematoxylin, scale bars 20 μm. Yellow arrows highlight phospho-Erk1/2 in nuclei of β-catGOF; Mll1−/− crypt cells. (B) Representative immunohistochemistry for Mll1 (left) and phospho-Erk1/2 (right) on serial sections of Mll1−/− intestinal crypts at 50 d post induction (marked by asterisks), compared with adjacent non-recombined crypt (left). Alcian blue stains mucus-containing and goblet cells, nuclei counterstained with haematoxylin, scale bars 25 μm. (C) Bright-field images of β-catGOF; Mll1−/− organoids cultured in ENR (control) and treated with 5 μM Mek inhibitor U0126 for 72 h in NR without EGF. Quantification of organoid diameter on the right, measured from at least 27 organoids per condition. Mann–Whitney U test, ****<0.0001. Scatter plot with median. (D) Immunofluorescence for BrdU (red) and GFP (green) in crypts of Mek1GOF; Mll1+/− mice and Mek1GOF; Mll1−/− mice at day 10 after induction of mutagenesis, nuclei in blue (DAPI), scale bars 20 μm. Recombined crypts are surrounded by dashed lines. BrdU was incorporated for 2 h before euthanasia. Right: quantification of BrdU+ cells per total cells in mutant crypts of Mek1GOF; Mll1+/− mice and Mek1GOF; Mll1−/− mice compared with adjacent non-recombined crypts, n = 4 independent mice per genotype, Mann–Whitney U test, ****P < 0.0001, ***P = 0.0001. Box plot indicates median (middle line) and 25th, 75th percentile (box) with Tukey whiskers. (E) Representative H&E stainings on sections of small intestines of Mek1GOF; Mll1+/− and Mek1GOF; Mll1−/− mice at 10 d after induction with tamoxifen, scale bars 100 μm. Stainings were performed in five independent mice per genotype. (F) Quantification of crypt and villus length in Mek1GOF; Mll1+/− and Mek1GOF; Mll1−/− mice (n = 5 independent mice per genotype) relative to n = 3 independent wild-type control mice, at least 15 crypt-villus units per mouse measured as indicated in (D), Mann–Whitney U test, ****P < 0.0001. Box plots indicate median (middle line) and 25th, 75th percentile (box) with Tukey whiskers. (G) Immunohistochemistry for β-catenin (right) and Axin2 in situ hybridisation (left) on sections of Mek1GOF; Mll1+/− and Mek1GOF; Mll1−/− intestine, nuclear counter-staining with haematoxylin and nuclear fast red, respectively, scale bars 50 μm. Mutant crypts are surrounded by dashed lines. Green and yellow arrows mark cells with nuclear β-catenin in non-recombined control and mutant crypts, respectively.

