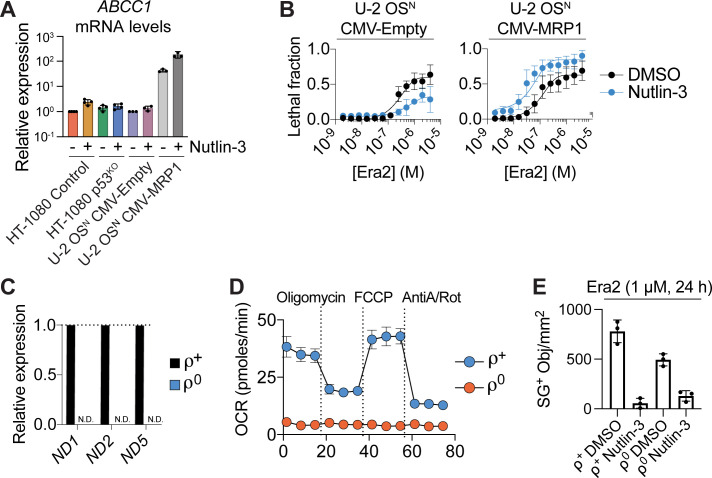
Figure S2. p53 stabilization does not suppress ferroptosis via effects on glutathione export or mitochondrial function.
(A) Relative mRNA expression determined using RT-qPCR. Nutlin-3 was used at 10 μM (48 h). (B) Cell death in cells that overexpress an empty control vector (CMV-Empty) or MRP1 (CMV-MRP1), after pretreatment ± nutlin-3 (10 μM, 48 h) then treatment with erastin2 (48 h). (C) Relative mRNA expression for three mitochondrial DNA-encoded transcripts in HT-1080 rho (ρ) positive or rho negative cell lines. N.D., not detectable. (D) Oxygen consumption rate determined in HT-1080 ρ+ and ρ0 cell lines, as determined using Seahorse technology. AntiA, antimycin A; Rot, rotenone. (E) SYTOX Green–positive (SG+) dead cell counts in HT-1080 ρ+ and ρ0 cell lines pretreated ± nutlin-3 (10 μM, 48 h), then treated with Erastin2. Data information: In (A, B, C, D, E), data are mean ± SD from three independent experiments.

