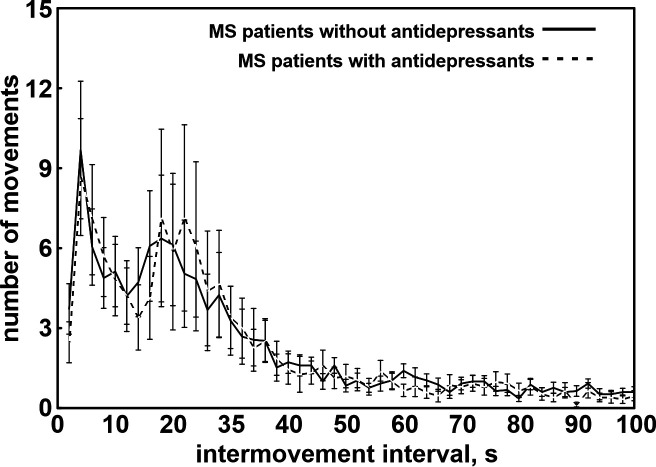
Figure 3. Distribution of intermovement intervals of the total leg movement activity during sleep recorded in the participants.
Linear regression lines are also shown (continuous line for MS+RLS and dashed line for iRLS). iRLS = idiopathic restless legs syndrome, MS = multiple sclerosis, NS = not significant, r = Pearson’s correlation coefficient, RLS = restless legs syndrome.

