
Figure 2.
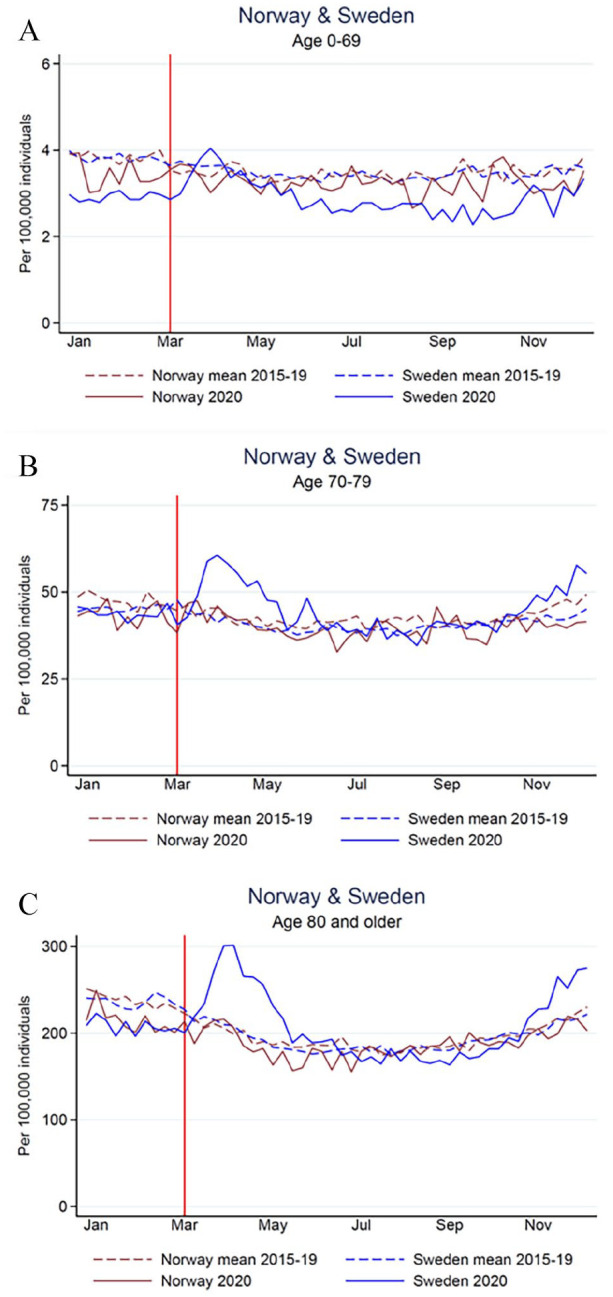
All-cause mortality rates per 100,000 person-weeks in age groups (A) 0–69 years, (B) 70–79 years and (C) ⩾80 years in Norway (brown) and Sweden (blue) for 2020 (solid lines) and mean 2015–2019 (dashed lines) and COVID-19-associated mortality rates (dotted lines). The red vertical line shows the time point for the first COVID-19-associated deaths in Norway and Sweden (11 and 12 March 2020).