
Figure 3.
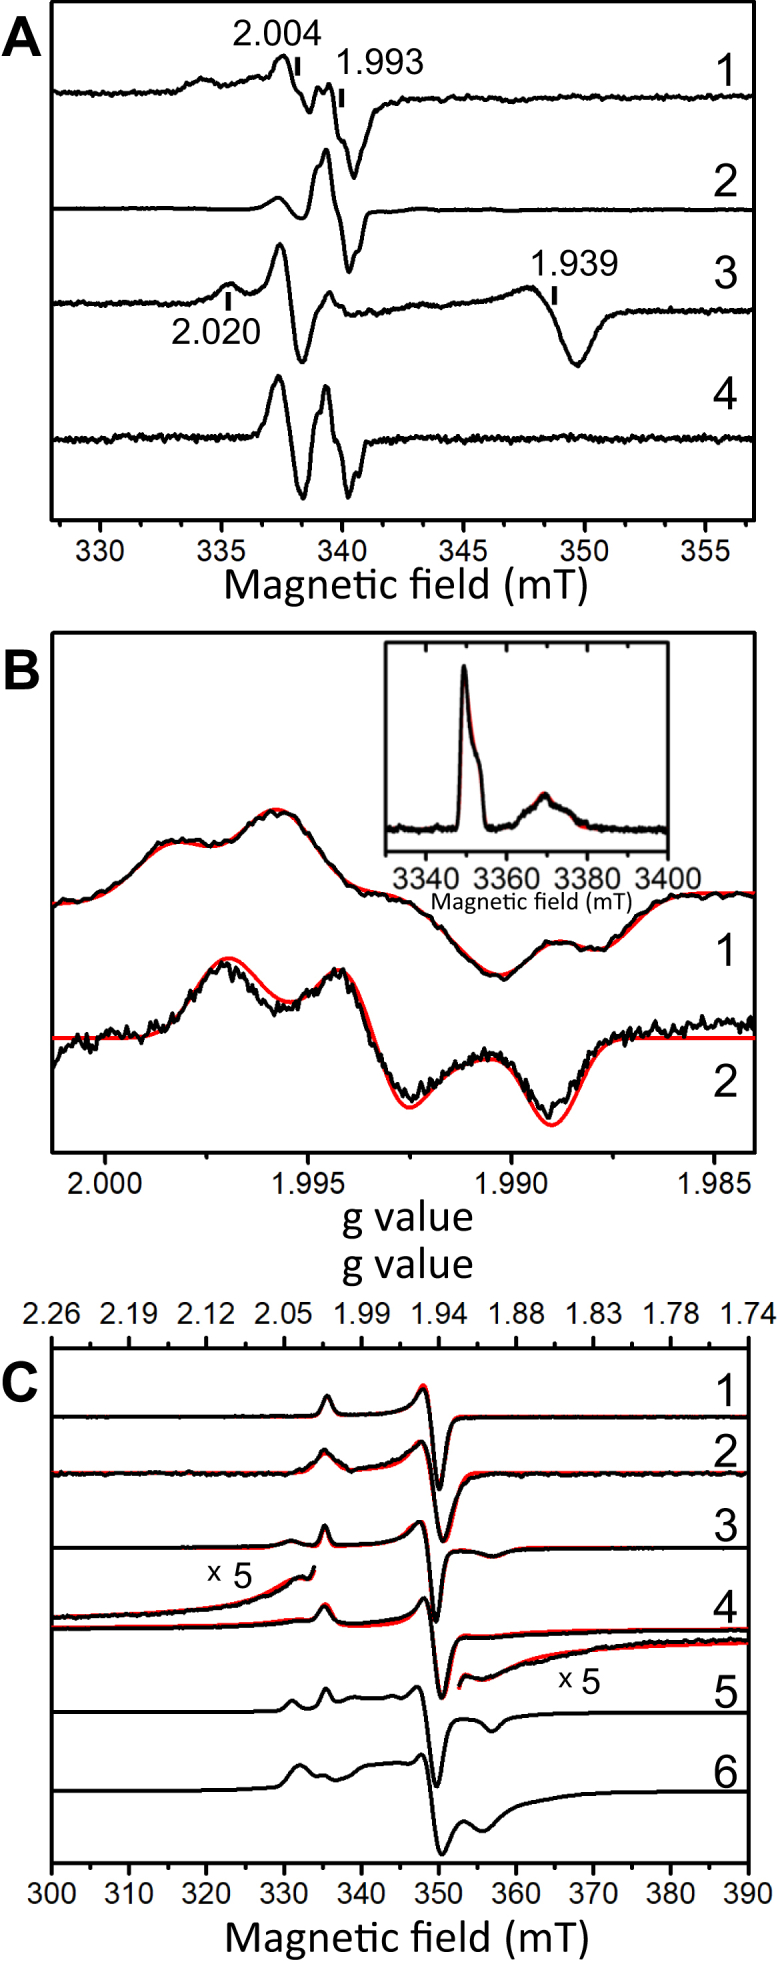
EPR characterization of the cofactors in ForCE1 and ForCE2.A, air-oxidized (1 and 2) and formate-reduced (3 and 4) ForCE1 (1 and 3) and ForCE2 (2 and 4) collected at 50 K (1) or 70 K (2–4). Other experimental conditions were as follows: microwave power, 4 mW, field modulation amplitude, 0.4 mT (1 and 2) or 0.2 mT (3 and 4) at 100 kHz, and microwave frequency, ∼9.48 GHz. Vertical lines indicate remarkable g values given in the figure and discussed in the main text. B, continuous wave Mo(V) EPR spectra in air-oxidized ForCE2 samples measured at X band (9.47864 GHz) (1) and Q band (34.1187 GHz) (2) frequencies. Other experimental conditions were as follows: temperature, 70 K (1) and 50 K (2), microwave power, 1 mW (1) and 0.1 mW (2), and field modulation amplitude, 0.1 mT (1) and 0.5 mT (2) at 100 kHz. The inset shows the echo-detected field-swept EPR spectrum measured at 50 K at W-band (94.0014 GHz) frequency. Other experimental conditions are as follows: microwave pulse lengths, 20 ns and 40 ns for π/2 and π pulses, respectively. C, EPR spectra of dithionite-reduced ForCE1 (1, 3, and 5) and ForCE2 (2, 4, and 6) measured at 100 K (1 and 2), 50 K (3 and 4), or 15 K (5 and 6). Other experimental conditions were as follows: microwave power, 1 mW (1) or 10 mW (2–6), modulation amplitude 1 mT (1, 2, 4–6) or 0.4 mT (3) at 100 kHz, microwave frequency, ∼ 9.48 GHz. Spectral simulations are displayed as red traces superimposed to the experimental spectra and have been performed using the parameters given in the main text and supporting information (Table S8).