
Figure 2.
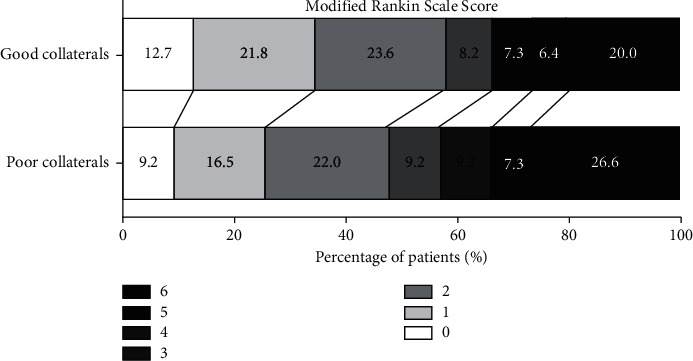
Distribution of functional outcomes at 90 days (poor collaterals versus good collaterals). Functional outcomes were estimated by the scores on the modified Rankin scale ranging from 0 to 6.
Official websites use .gov
A
.gov website belongs to an official
government organization in the United States.
Secure .gov websites use HTTPS
A lock (
) or https:// means you've safely
connected to the .gov website. Share sensitive
information only on official, secure websites.
Distribution of functional outcomes at 90 days (poor collaterals versus good collaterals). Functional outcomes were estimated by the scores on the modified Rankin scale ranging from 0 to 6.