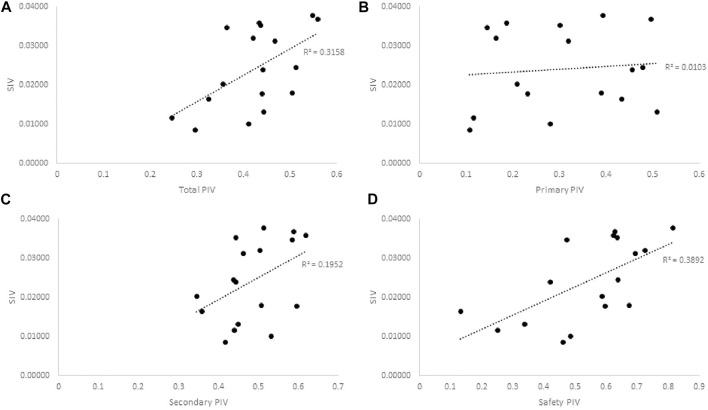
FIGURE 2.
Pearson correlation plots of the SIV and PIV of Cree medicinal plants bioactivity in (A) All assays, r 2 = 0.3158, p = 0.019, (B) Primary anti-diabetes Assays, r 2 = 0.0103, p = 0.7, (C) Secondary anti-diabetes Assays, r 2 = 0.1952, p = 0.076, and (D) Safety assays, r 2 = 0.3892, p = 0.0074. Greater SIV values indicate greater associated anti-diabetic potential based on ethnobotanical evidence. Greater PIV values indicate more significant relative activity in associated bioassays.

