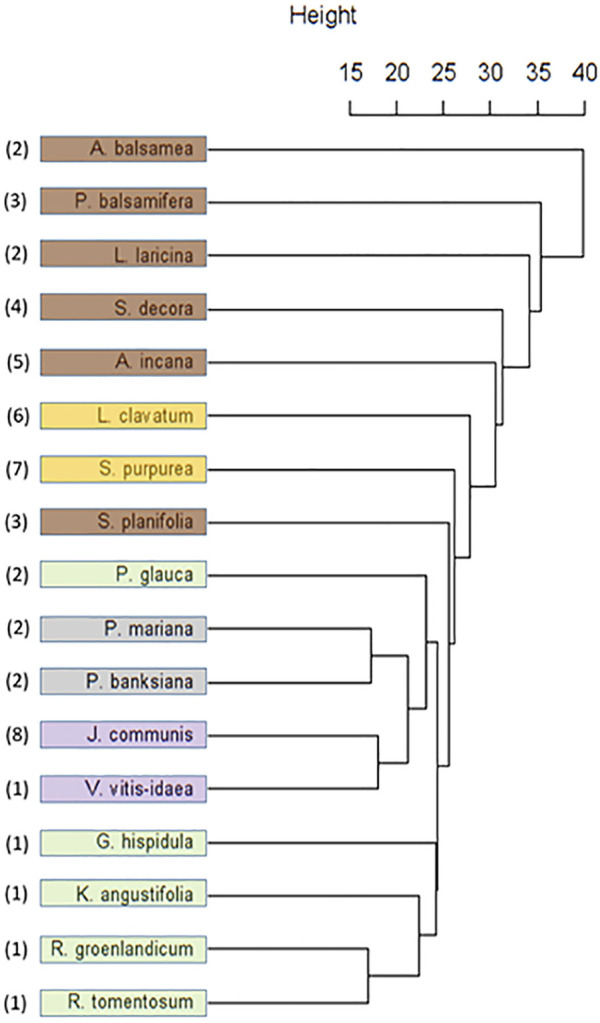
FIGURE 5.

Dendrogram resulting from Unweighted Pair Group Method with Arithmetic Mean (UPGMA) cluster analysis of Cree medicinal plant metabolomes. Species colouring indicates the plant part investigated: Brown (Bark), Yellow (Whole), Green (Leaf), Grey (Cone), Purple (Berry). Numbers indicate species family: 1 (Ericaceae), 2 (Pinaceae), 3 (Salicaceae), 4 (Rosaceae), 5 (Betulaceae), 6 (Lycopodaceae), 7 (Sarracenaceae), 8 (Cupressaceae).
