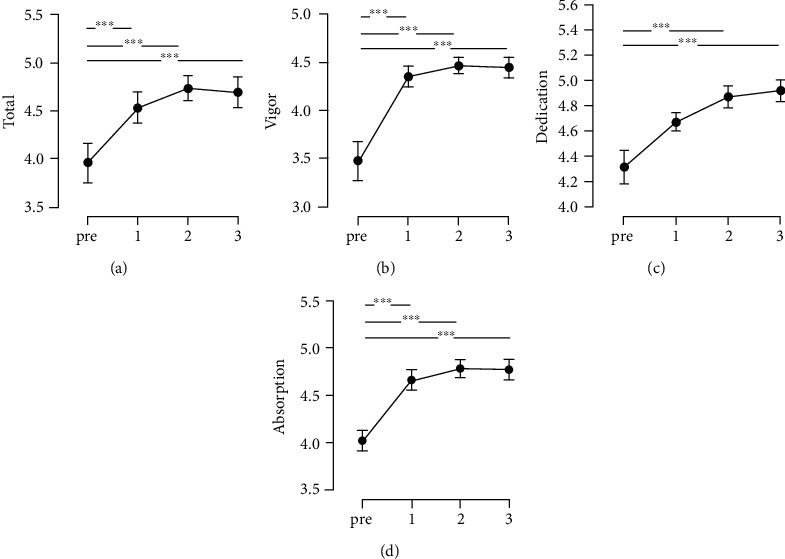
Figure 3.

Results of the Sport Engagement Scale total score and each factor score through each intervention. y-axis: raw score of SES; x-axis: intervention timeline. Error bars represent standard error (SE). (a) Total score of SES; (b) vigor; (c) dedication; (d) absorption. ∗∗∗pbonf < 0.001.
