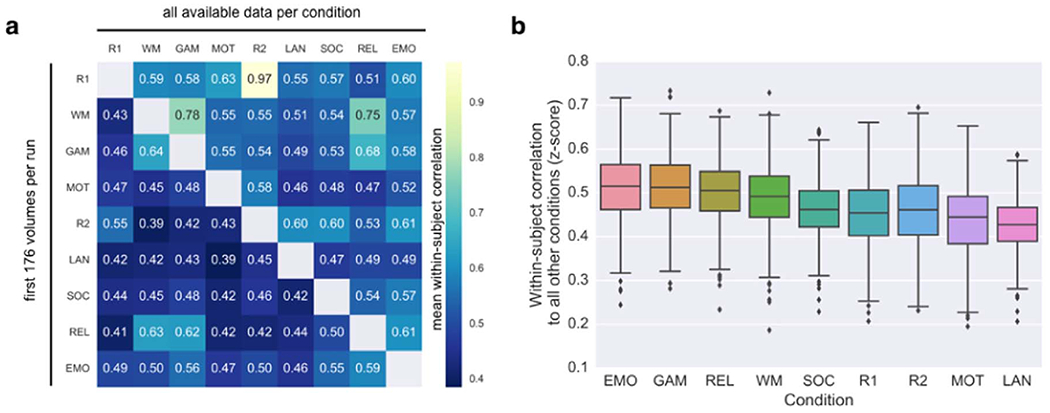
Fig. 4. Within-individual similarity varies between pairs of brain states.

(a) Within-subject correlations between connectivity matrices acquired during each of 36 pairs of conditions. Each cell i,j represents the mean within-subject correlation between the connectivity patterns in condition i and condition j. Lower triangle is based on connectivity matrices calculated using equal amounts of data per condition. Upper triangle is based on connectivity matrices calculated using all available data per condition (see Table 1 for scan durations). (b) Estimating how similar each state is to all other states within individuals. For each condition for each subject, correlations to all eight other conditions are averaged (thus each subject contributes one value to the boxplot per condition). See Table 1 for condition abbreviations.
