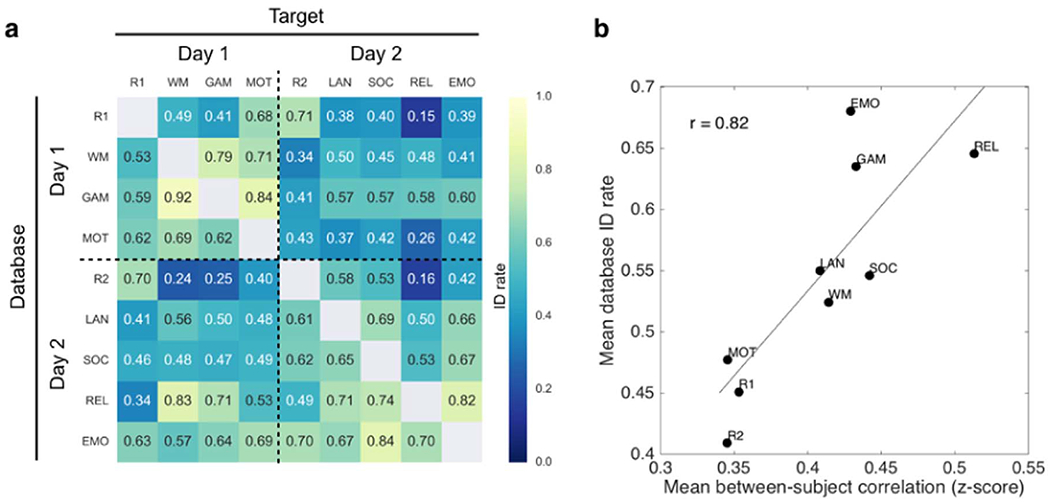
Fig. 5. Identification of individual subjects across brain states.

(a) Extension of the identification experiments described in Finn et al. (2015) using n=716 subjects each scanned during nine conditions. Identification (ID) rate denotes the overall accuracy of an iterative algorithm that attempts to match a given subject’s connectivity matrix from one condition (target) to the matrix of the same subject from a different condition (database). The roles of target and database may then be reversed, resulting in 72 possible identification experiments between rest-rest, rest-task and task-task scan pairs. Chance rate is approximately 0.001 (1/716). (b) Mean database ID rate (average across each row of the matrix in panel (a)) plotted against mean between-subject correlation (Fisher-transformed z-score; cf. Fig. 3a) for all nine conditions. Conditions that make subjects look more similar tend to make better databases for identification experiments (r(7)=0.82, p=0.007). See Table 1 for condition abbreviations.
