Fig. 1.
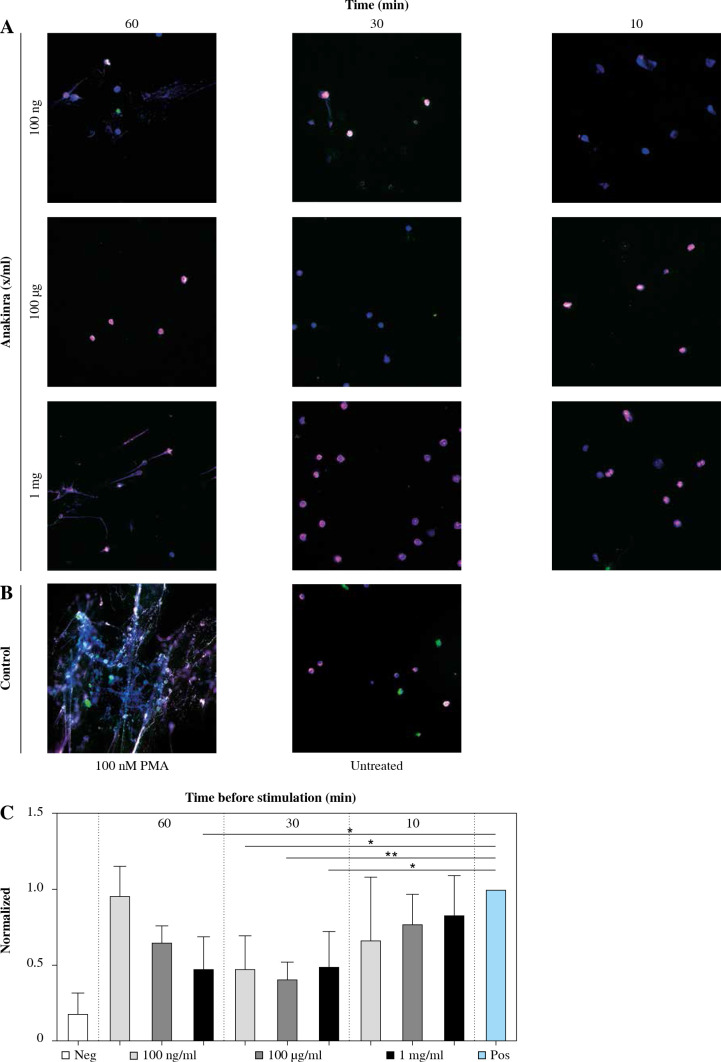
Immunofluorescence stain- ing of anakinra pretreated and PMA-stimulated neutrophils. Cells were pretreated with anakinra (100 ng/ml, 100 µg/ml, 1 mg/ml) for 60, 30 and 10 minutes before stimulation with 100 nM PMA for 3 hours (A). DNA was stained with DAPI (blue), NE (pink/AF 647) and MPO (green/FitC). Positive control: Cells were not pretreated with anakinra and stimulated with 100 nM PMA for 3 hours; negative control cells did not receive any treatment (B). DNA and markers were stained as described before and imaged at a magnification of 40×. Graphics show averages ±SD of mean gray value of signal per area of five images (four extremes and center) per slide performed in triplicate and analyzed with ImageJ software for DAPI-DNA (C)

