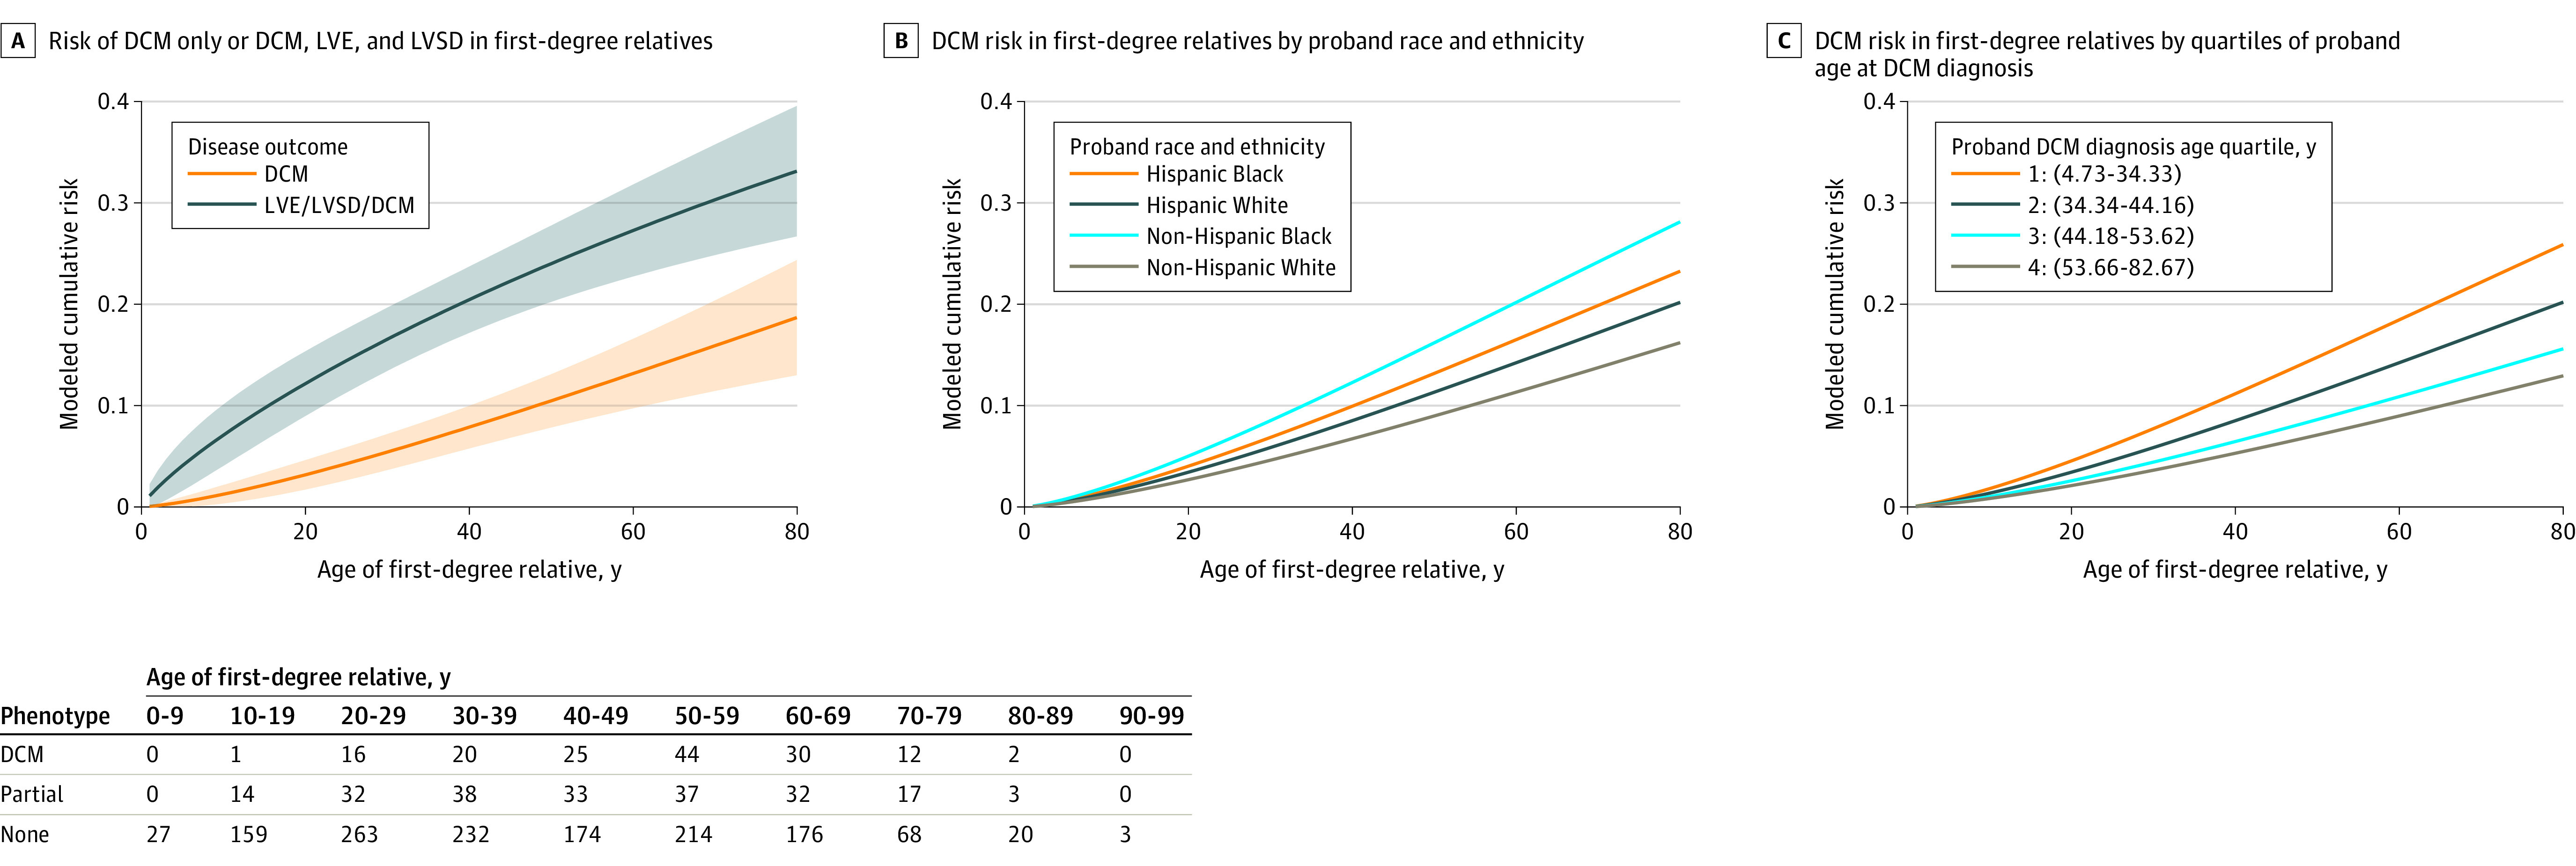
Figure. Model-Based Estimates of Age-Specific Cumulative Risk in First-degree Relatives of Patients With Dilated Cardiomyopathy (DCM).

A Weibull proportional hazards model for age-specific cumulative risk was fit to cross-sectional data on disease status at enrollment from first-degree relatives. Each panel presents marginally standardized age-specific cumulative risks derived from this model fit that apply to first-degree relatives of patients seen at a typical US advanced heart failure program, defined as a program at the mean or mode of the random effects distribution describing the population of such programs. Marginally standardized age-specific cumulative risks were calculated by obtaining conditional estimates at a typical US advanced heart failure program in each first-degree relative subpopulation defined by a combination of the covariates and then taking the weighted average according to an assumed covariate distribution described for each panel. A, Each patient subpopulation defined by race and ethnicity was assumed to be balanced across the 16 possible sex (first-degree relative and proband) and proband DCM diagnosis age quartile combinations. These subpopulations, in turn, were represented in proportion to 2019 US Census population estimates (0.99% Hispanic Black, 13.97% non-Hispanic Black, 18.06% Hispanic White, 66.98% non-Hispanic White) in the overall marginally standardized age-specific cumulative risk. Bands represent delta method pointwise 95% CIs. Numbers of individuals within age strata by phenotype are provided in the table below the figure. B, Each patient subpopulation defined by race and ethnicity was assumed to be balanced across the 16 possible sex (first-degree relative and proband) and proband DCM diagnosis age quartile combinations. C, Each subpopulation of first-degree relatives defined by proband DCM diagnosis age quartile, race, and ethnicity was assumed to be balanced across the 4 possible sex (first-degree relative and proband) combinations. Marginally standardized estimates for a particular subpopulation defined by proband DCM diagnosis age quartile were then obtained by weighting race and ethnicity groups in proportion to 2019 US Census population estimates (0.99% Hispanic Black, 13.97% non-Hispanic Black, 18.06% Hispanic White, 66.98% non-Hispanic White). LVE indicates left ventricular enlargement; LVSD, left ventricular systolic dysfunction.
