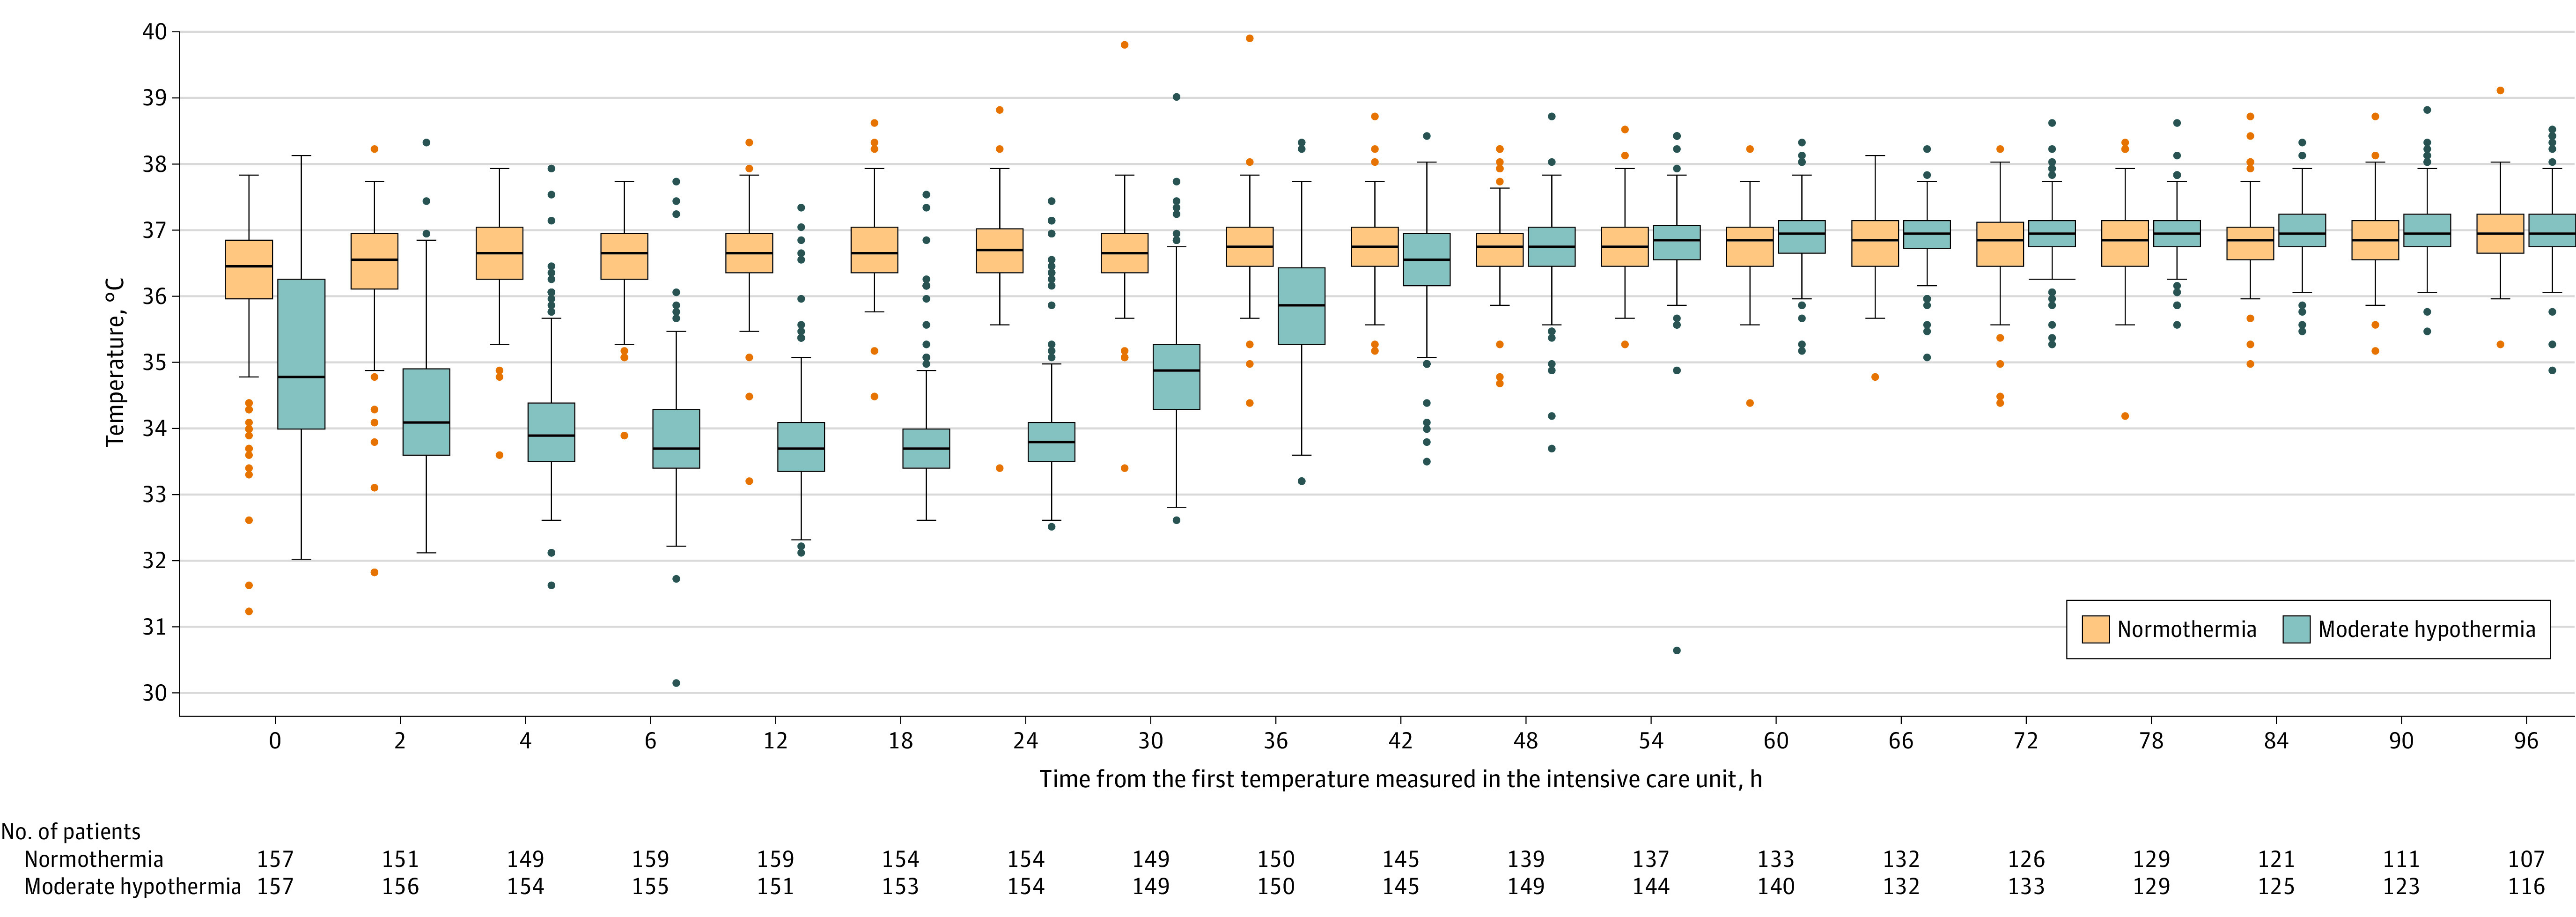
Figure 2. Core Body Temperatures Measured in the Intensive Care Unit During the First 96 Hours After Randomization.

The middle line in the box plot represents the median observed esophageal core temperatures in the moderate hypothermia group (33-34 °C) and in the normothermia group (36-37 °C). The boxes represent the IQR. The whiskers extend to the most extreme observed values with 1.5 × IQR of the nearer quartile. The dots represent the observed values outside that range. Temperature control was initiated just after randomization but before admission to the intensive care unit (ICU), which explains the between-group differences in esophageal temperature at ICU admission. The median time from venoarterial extracorporeal membrane oxygenation to randomization was 3.0 hours (IQR, 1.7-4.5 hours). The median time from randomization to the first measured temperature was 30 minutes (IQR, 8-82 minutes).
