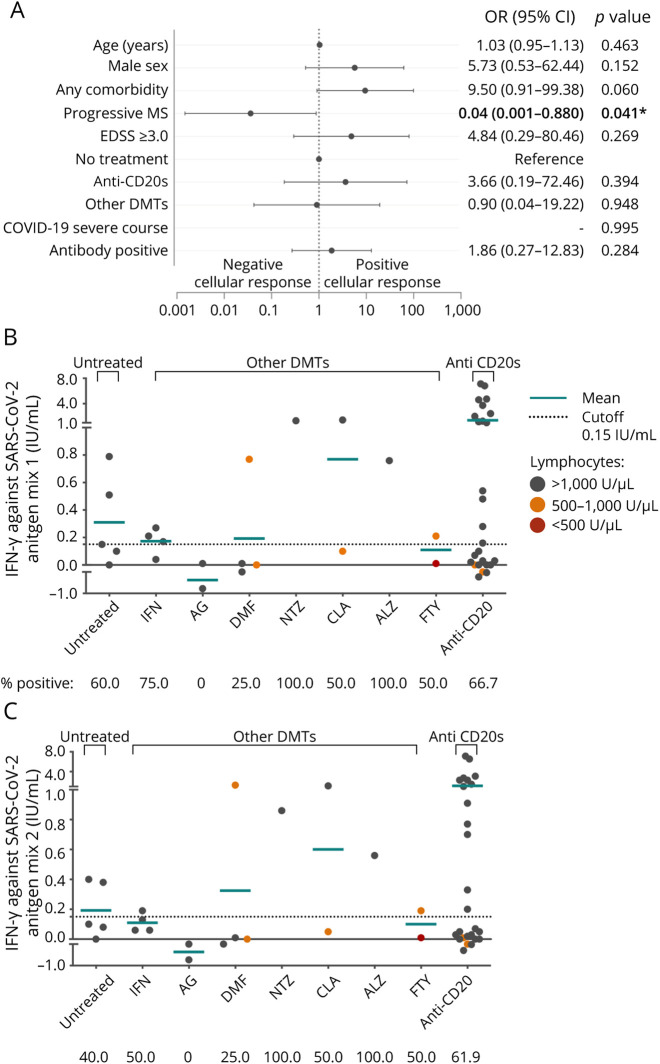
Figure 2. Cellular Response to SARS-CoV-2.
(A) Forest plot depicting adjusted ORs for presenting cellular response against SARS-CoV-2 (n = 42). Demographic and clinical characteristics, comorbidities, and laboratory data are represented with OR, 95% CI, and p values. In dichotomous variables, the reference is not specified. Statistical analysis was performed using a logistic regression model adjusted for age, sex, presenting any comorbidity, MS phenotype EDSS, DMTs, COVID-19 severity, and positive SARS-CoV-2 antibody. (B and C) Mean titers of interferon-gamma produced by T-cell against SARS-CoV-2 antigen mix 1 (A) and SARS-CoV-2 antigen mix 2 (B); each dot represents a different subject. Statistical analysis was performed using a Mann-Whitney test analysis, no statistical differences were found. Cutoff values for positive cellular response are indicated by a dotted line. Values over the lower line of the gray area are considered positive. Spot's color indicates previous lymphocyte count >1,000 U/µL (gray), between 500 and 1,000 U/µL (orange), and <500 cells/mm3 U/µL. Any comorbidity includes obesity, lung disease, cardiovascular disease, diabetes, hypertension, hematologic benign disease, chronic kidney disease, liver disease, HIV, or malignancy. *Statistically significant, p value <0.05. Ab = SARS-CoV-2 antibody; ALZ = alemtuzumab; CLA = cladribine; COVID-19 = coronavirus disease 2019; DMF = dimethyl fumarate; EDSS = Expanded Disability Status Scale; FTY = fingolimod; GA = glatiramer acetate; IFN = interferon; ns = not significant; NTZ = natalizumab; OCR = ocrelizumab; other anti-CD20 = other anti-CD20 therapies; other DMTs = patients with disease-modifying treatment different from anti-CD20 therapies; progressive MS = secondary progressive MS and primary progressive MS; RTX = rituximab; SARS-CoV-2 = severe acute respiratory syndrome coronavirus 2; TFN = teriflunomide.

