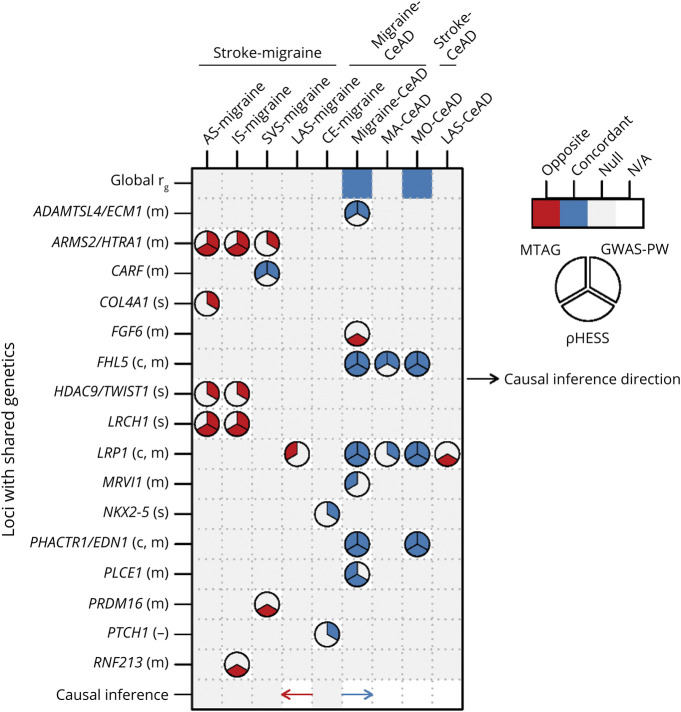
Figure 2. Summary of Pairwise Genetic Comparisons for the 3 Disorders.
Only pairs with significant associations are shown. For Mendelian randomization, the direction of each arrow indicates whether the direction of inferred causality is from the first disorder of each pair to the second (rightward arrow) or the opposite (leftward arrow) with concordant (blue) or opposite (red) functional relationship. Symbols following gene name labels for each locus refer to the disorder(s) for which association has been previously reported, if any, as follows: m = migraine, c = CeAD, s = stroke, and - = no known association. CeAD = cervical artery dissection; GWAS-PW = genome-wide association study-pairwise; MTAG = multitrait analysis of GWAS; ρHESS = ρ Heritability Estimation from Summary Statistics.

