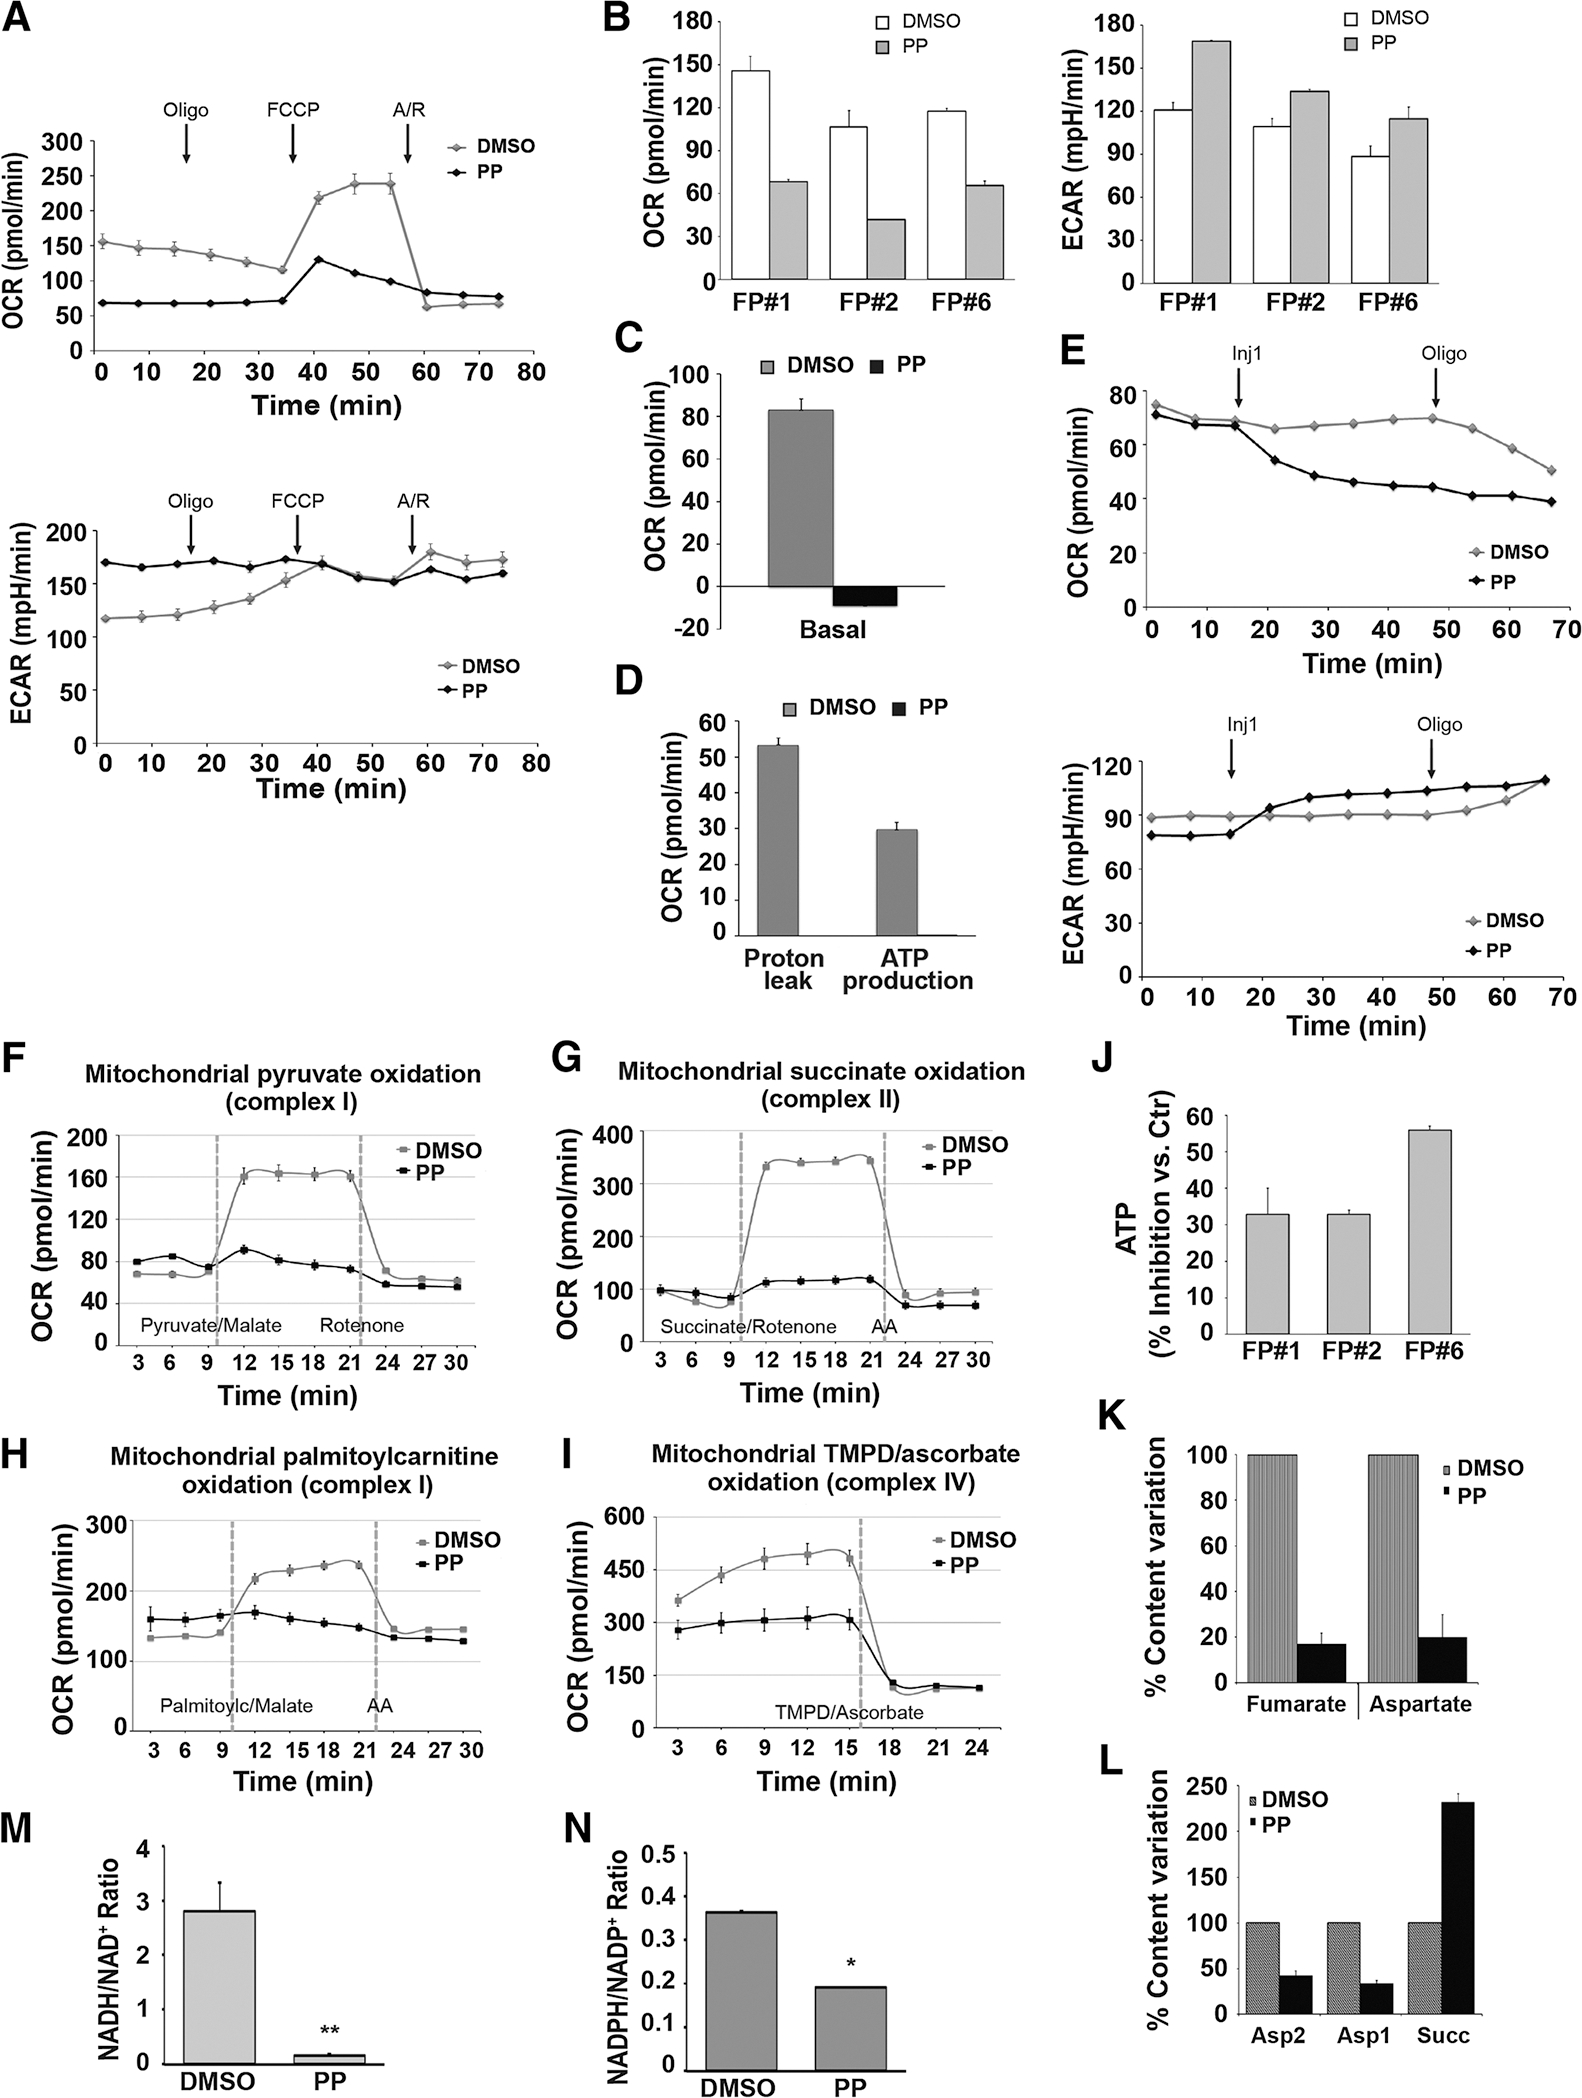
Figure 2.

PP acts as an inhibitor of multiple ETC complexes and generates a metabolic crisis. A–D, Cellular respiration and glycolysis of FP#1, FP#2, and FP#6 CSC clones treated with 100 nmol/L PP or DMSO for 12 hours and analyzed by mitochondrial stress test. OCR and ECAR were measured before and after sequential injections of 1 μmol/L oligomycin, 1 μmol/L FCCP, and combination of antimycin A/rotenone (A/R), 0.5 μmol/L each. A, Representative plots for measurements in FP#1 clones are shown. B, Bar histograms show basal respiration and ECAR of PP- and DMSO-treated cells. Quantitative analysis demonstrates differences in basal response (measurements 1–3). Proton leak (C) and ATP production (D). All experiments were performed at least twice, and each data point represents the mean ± SD, n = 3. Representative graphs (C and D), relative to FP#1 CSCs, are shown. E, OCR (top) and ECAR (bottom) were measured in in FP#1 by a mitochondrial stress test before and after sequential injections of 400 nmol/LPP or DMSO (Inj1 = measurements 4–8) and oligomycin as indicated (oligomycin = measurement 9–11). F–I, FP#1 CSCs treated with 100 nmol/L PP or DMSO for 12 hours were permeabilized with the XF Plasma Membrane Permeabilizer. Specific substrate oxidation was examined by measuring OCR changes. Each data point represents the mean ± SD, n = 3. Representative graphs of at least two experiments are shown. Data analysis was performed using Wave 2.4 (Seahorse Bioscience). F, Oxidation of complex I-linked substrates. OCR was measured before and after sequential injections of pyruvate with malate (measurements 4–7) and rotenone. G, To measure complex II activity, OCR was measured before and after sequential injections of succinate with rotenone (measurements 4–7) and antimycin A. H, OCR was measured prior to and after sequential injections of palmitoyilcarnitine (measurements 4–7) and antimycin A. I, Cytochrome C oxidase activity: OCR was measured after injection of TMPD with ascorbate (measurements 5–7; Materials and Methods). J, FP#1, FP#2, and FP#6 cells cultured with 100 nmol/L PP or DMSO for 12 hours and ATP levels were measured. The percent inhibition of ATP content compared with control cells was calculated as the mean ± SD of three independent experiments, performed using multiple replicates. K and L, FP#1 cells treated with DMSO or 100 nmol/L PP were cultured for 12 hours and analyzed by nuclear magnetic resonance spectroscopy (see Materials and Methods). K, Fumarate and aspartate signal intensities in DMSO- and PP-treated cell spectra (as a percentage of/normalized to DMSO-treated sample value). L, Aspartate and succinate signal intensities from DMSO and PP-treated PCA extracts spectra (as a percentage of/normalized to DMSO-treated sample value). Data are the mean ± SD of three different experiments. FP#1 cells treated with DMSO or 100 nmol/L PP were cultured for 24 hours and the NADH/NAD+ ratio (M) and the NADPH/NADP+ ratio (N) were measured. *, P < 0.05; **, P < 0.01.
