Figure 6.

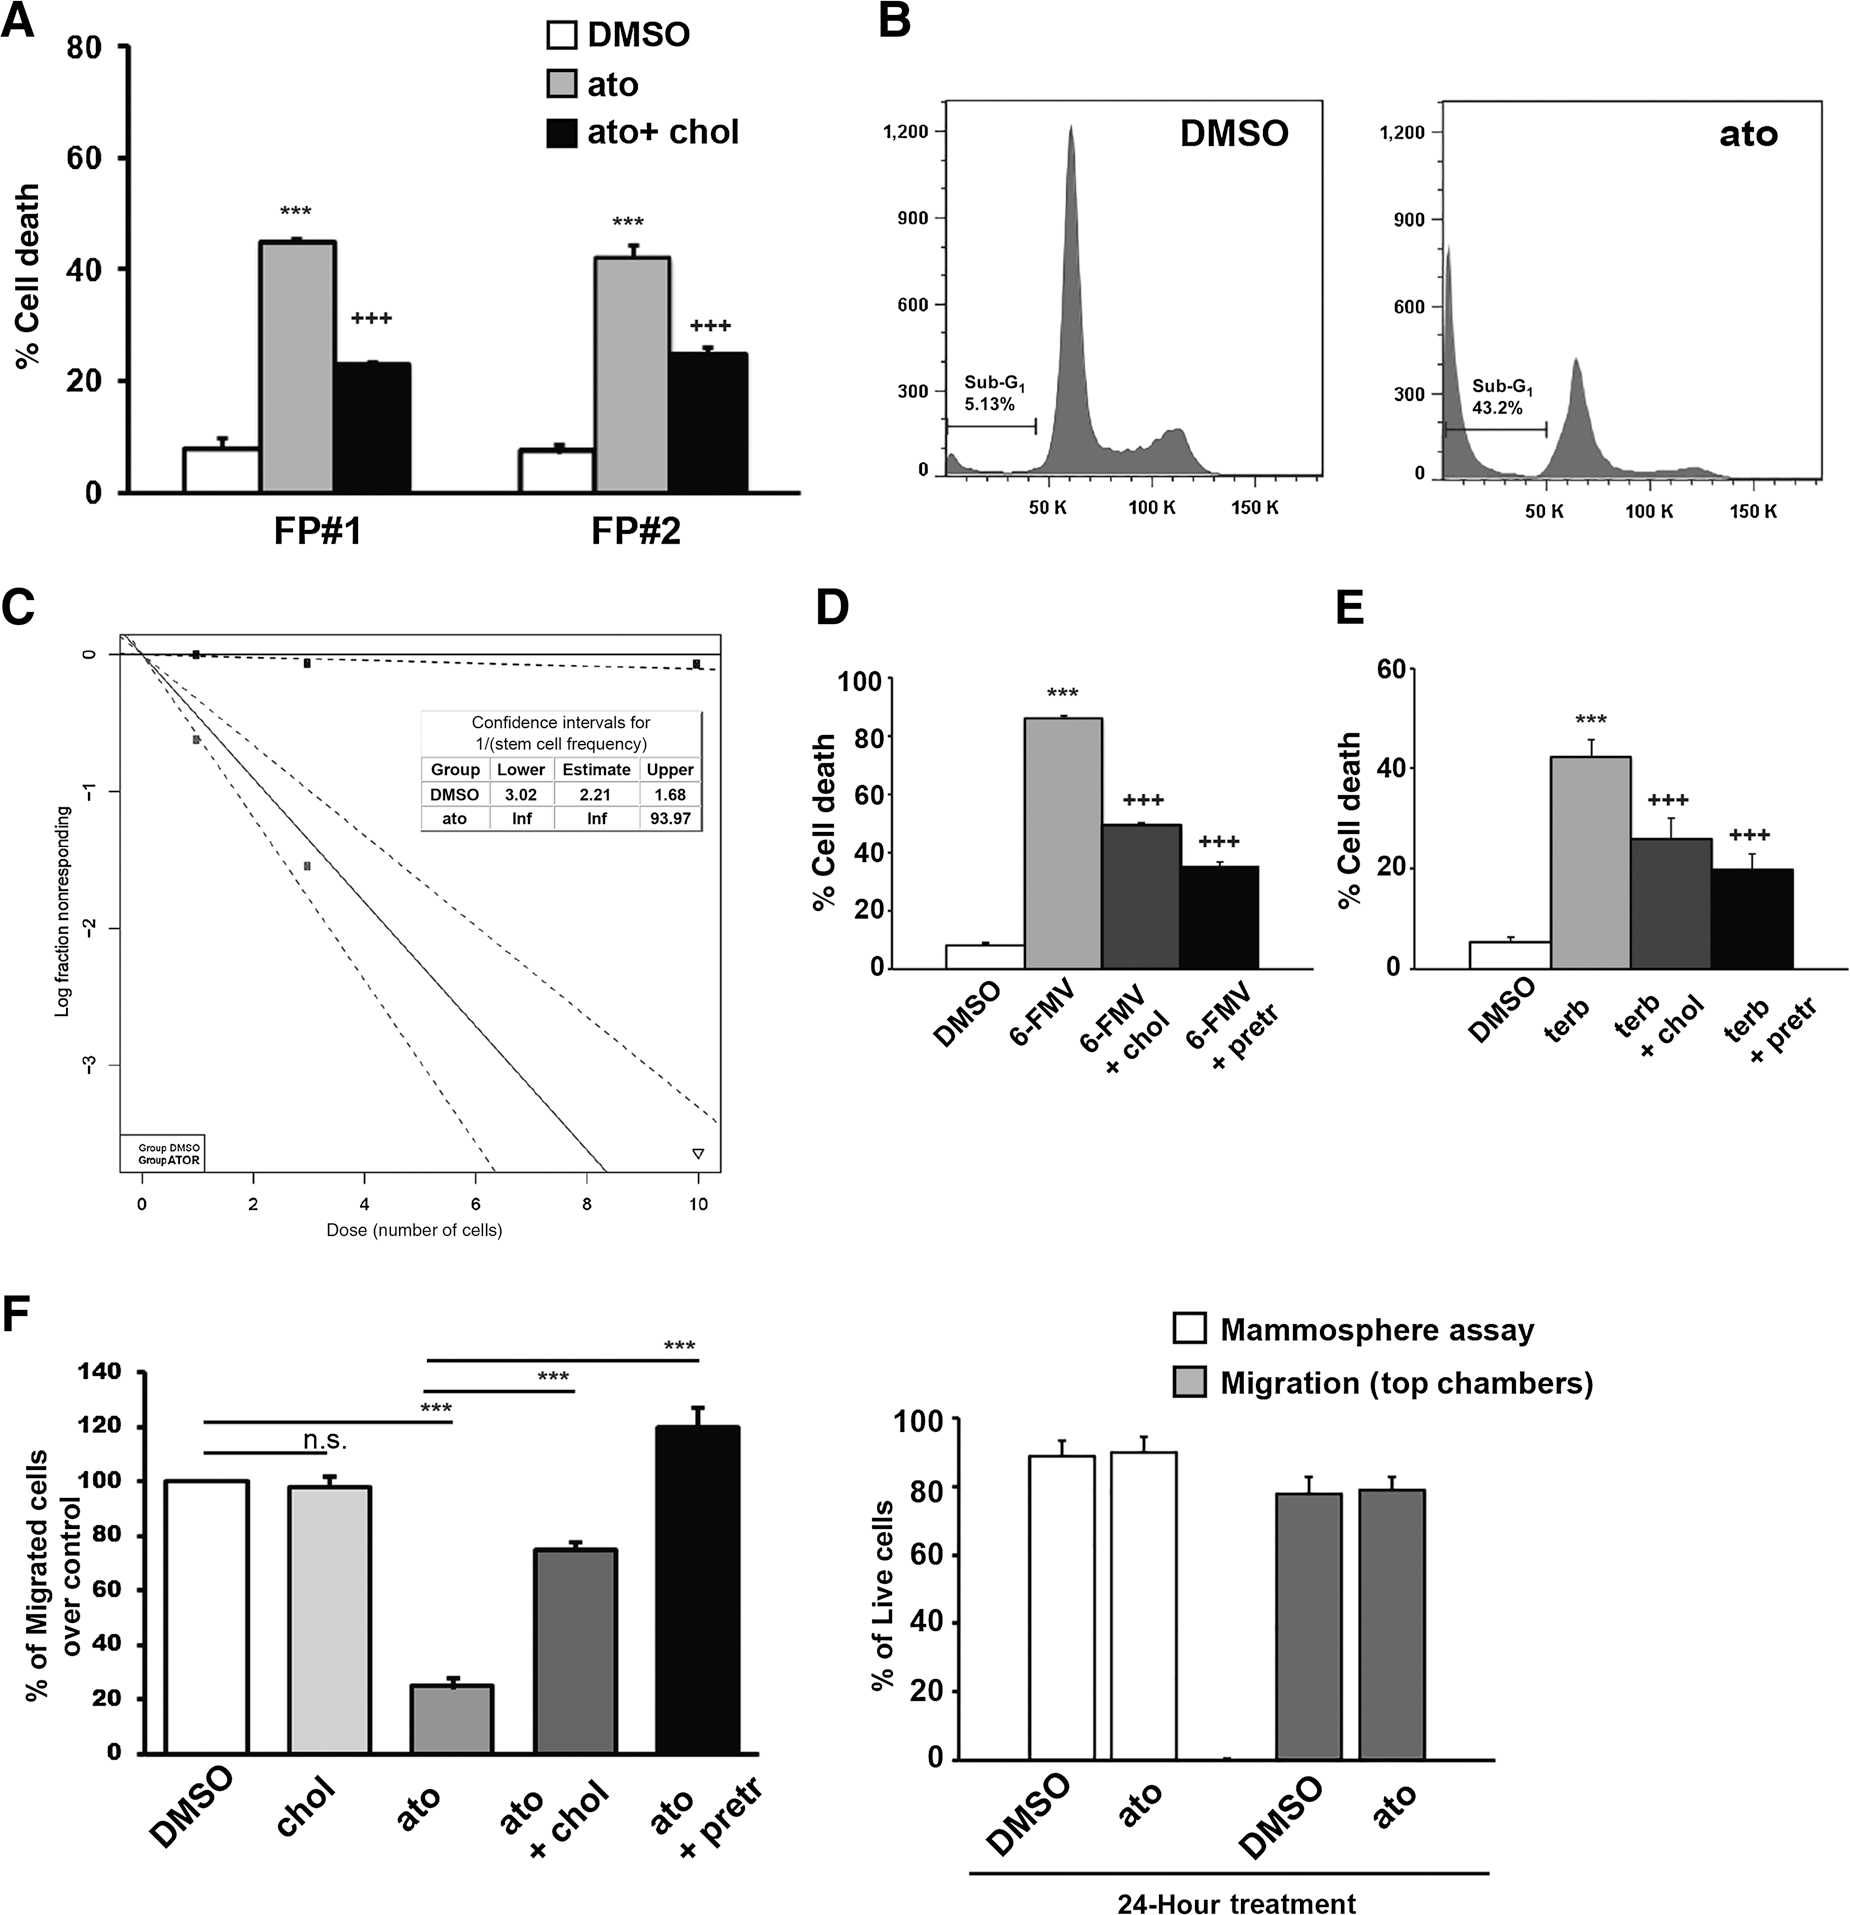
Cholesterol is essential to FP-CSC survival and migration. A, FP#1 and FP#2 CSCs were treated with DMSO, 10 μmol/L atorvastatin (ato), or atorvastatin combined with 10 μmol/L cholesterol and cultured for 72 hours. The percentage of cell death was evaluated by the trypan blue exclusion method. B, Cell death in FP#1 CSCs was also measured by PI staining and flow cytometry. The percentage of SubG1 events is shown in a representative dot plot of three independent experiments performed in triplicate. C, FP#1 spheres were dissociated into single cells and seeded in the presence of DMSO or 10 μmol/L atorvastatin and analyzed by LDA. Log-fraction plot of dilution model fitted to the data was generated using ELDA software. The slope of the line is the log-active cell fraction. The dotted lines indicate 95% confidence interval. The data value with zero negative response at corresponding dose is represented by a down-pointing triangle. Table showing the stem cell frequency in cells treated with DMSO (gray line) or atorvastatin (ato; black line). D, FP#1 CSCs were treated with DMSO, 50 μmol/L 6-Fluoromevalonate (6-FMV), or combination of 6-FMV plus 10 μmol/L cholesterol (+chol) or pretreated for 12 hours with 10 μmol/L cholesterol (+pretr) before adding 6-FMV and cultured for 72 hours. The percentage of cell death was evaluated by Trypan blue exclusion method. E, FP#1 CSCs were treated with DMSO or 60 μmol/L terbinafine (terb) or terb plus 10 μmol/L cholesterol (+chol) or pretreated for 12 hours with 10 μmol/L cholesterol (+pretr) before adding terbinafine, and cultured for 72 hours. The percentage of cell death was evaluated by trypan blue exclusion method. Histograms in D and E indicate the mean ± SD of at least three independent experiments. Drug vs. DMSO: ***, P < 0.001; Drug+cholesterol versus drug alone: +++, P < 0.001. F, Left, In vitro migration assay of FP#1 cells treated with 10 μmol/L atorvastatin alone or in combination with 10 μmol/L cholesterol or pretreated for 12 hours with cholesterol (+pretr) before adding atorvastatin. Histogram quantifies relative migratory capacities. The results shown in the figure are the mean ± SD of 5 independent experiments. ***, P < 0.001. Right, cell viability of FP#1 after 24 hours of atorvastatin treatment. White bars, cells were treated with DMSO or 10 μmol/L atorvastatin and cultured in mammosphere assay. Gray bars, cells from the top part of migration chambers were collected after 24 hours of DMSO or atorvastatin treatment. Cell viability was evaluated by FACS analysis of 7-ADD–negative cells. Mean ± SD of three independent experiments is shown. n.s., nonsignificant.
