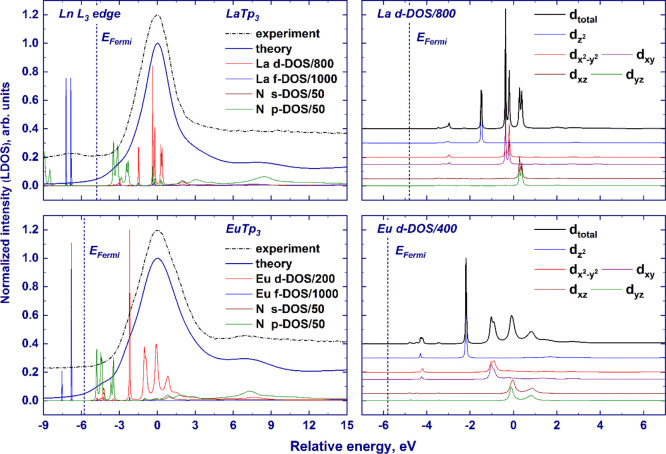
Figure 3.
Finite-difference-computed ligand DOS (Ln3+ cation d- and f-orbitals and N atom s- and p-orbitals) and normalized XANES spectra (left panel); dz2, dx2–y2 and dxy, dxz, and dyz orbitals of the lanthanide atom (right panel) in the LaTp3 and EuTp3 compounds. The experimental spectra are provided with the dashed–dotted lines. The spectral intensities have been scaled to the same maximum height, while the ligand DOSs are presented in arbitrary units (note that the ligand DOSs are scaled by the factors indicated in the legend). The theoretical curves are shown in a unified energy scale, with zero corresponding to the position of the white line. The Fermi-level positions are marked with vertical dashed lines. The experimental spectra are aligned along the X-axis to match the theoretical data.

