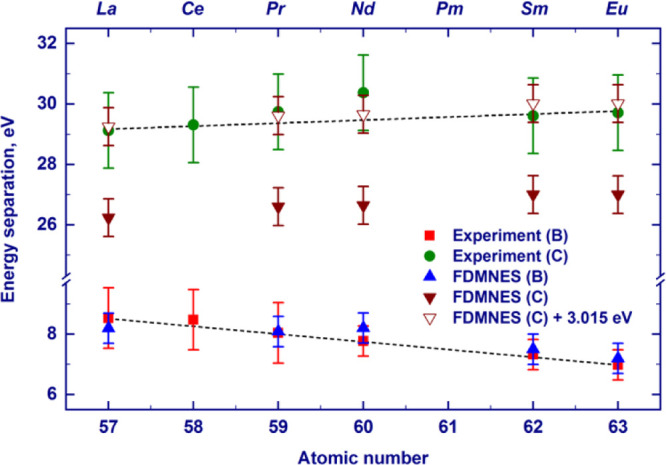
Figure 4.

Dependence of the energy separation between the white-line position and the maximum of the feature B (feature C) on the atomic number of the absorbing lanthanide atom obtained by the analysis of the experimental L3-absorption-edge XANES spectra of the LnTp3 compounds (B, squares; C, circles) and the corresponding spectra calculated by the FDMNES code (B, apex-up triangles; C, solid apex-down triangles). To fit the experimental data for feature C, the offset of 3.015 eV was added to the finite-difference calculated values (empty apex-down triangles). The offset value was obtained by the least-square fitting procedure. Dashed lines are guides to the eye.
