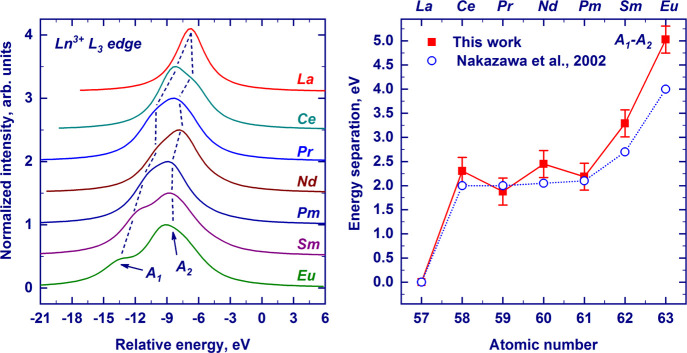
Figure 6.
Pre-edge regions of the Ln3+ L3-edge absorptions (Ln = La, Ce, Pr, Nd, Pm, Sm, and Eu) were obtained by the integration of the calculated 2p3d RIXS planes along the Y-axis. The curves are shown in a unified energy scale, with zero corresponding to the position of the white line. For Pm, the energy of the pre-edge feature was set to fit the data for the other lanthanides. A1 and A2 labels represent low- and high-energy quadrupolar features, respectively (left panel). The energy separation between the A1 and A2 features across the series was derived by the integration of the calculated 2p3d RIXS plane along the energy-transfer axis. Theoretical data from ref (56) are shown by open circles. Dashed lines are guides to the eye.

