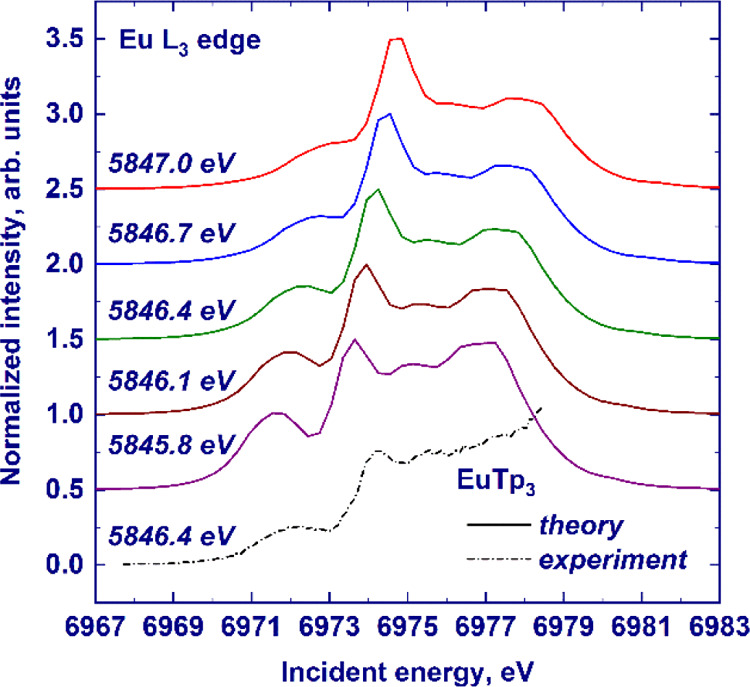
Figure 7.

HERFD-XANES spectra (solid lines) of the Eu3+ L3 absorption edge in EuTp3 calculated in the pre-edge region by atomic multiplet theory. The experimental spectrum is shown by the dashed–dotted line. For the sake of clarity, the spectra have been scaled to the same maximum height and offset along the Y-axis. The emitted energy at which the HERFD cut was recorded is provided on the left-hand side.
