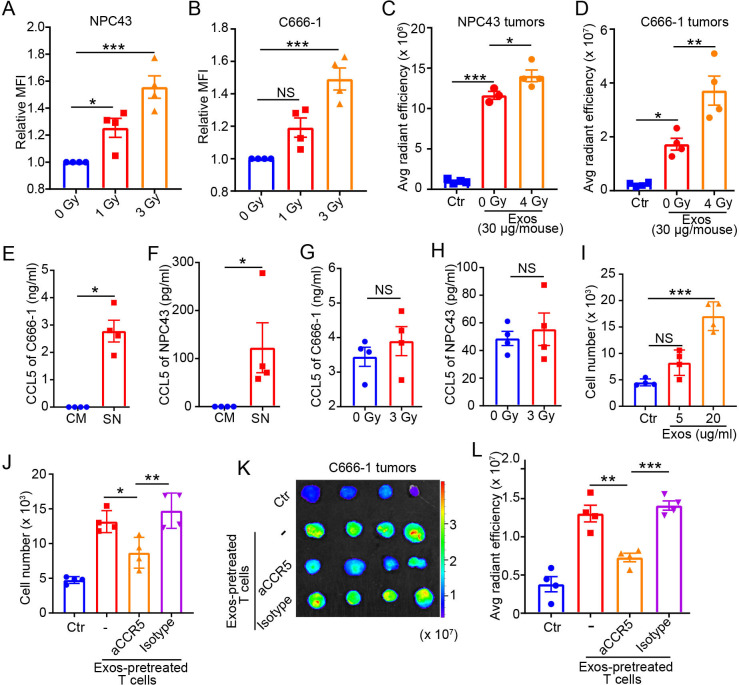
Figure 5.
Radiotherapy enhances NPC tumors to uptake Exos that promote T-cell migration into tumor microenvironment. NPC43 (A) or C666-1 (B) cells were irradiated at 0, 1, or 3 Gy, then cultured with CFSE-labeled Exos (20 µg/mL) isolated from four biological replicates. Twenty-four hours later, the fluorescent intensity of CFSE in NPC cells were determined by flow cytometry. The NPC43 (C) or C666-1 (D) tumor-bearing mice (n=3 or 4) were irradiated at 0 or 4 Gy and 3 days later were injected with DiR-labeled Exos (30 µg/mouse). Twenty-four hours postinjection, the tumors were excised and imaged ex vivo by In Vivo Imaging System. Ultracentrifuged pellets isolated from non-conditioned FBS–exosome-free medium without Exos components were used as Ctr. CCL5 in the CM or culture SNs of C666-1 (E) or NPC43 (F) cells. CCL5 in the culture SNs of C666-1 (G) or NPC43 (H) cells 24 hours after irradiation at 0 or 3 Gy. (I) Human CD3 T cells pretreated with PBS (Ctr) or Exos were cultured in the upper chamber of a Transwell assay; SNs from C666-1 cells were added to the bottom chamber. Four hours later, migration of Exos-pretreated CD3 T cells was calculated. (J) Exos-pretreated CD3 T cells were incubated with neutralizing aCCR5, isotype Ctr, or no antibody (−) for 30 min before added into the upper chamber. PBS-pretreated CD3 T cells were used as Ctr. (K, L) Exos-pretreated CD3 T cells were stained with DiR and then incubated with neutralizing aCCR5, isotype Ctr, or no antibody (−) for 30 min. PBS-pretreated CD3 T cells stained with DiR were used as Ctr. The human CD3 T cells were then administered intravenously into C666-1 tumor-bearing mice (n=4). Twenty-four hours later, the NPC tumors were excised, and migration of human CD3 T cells in tumor tissues was ex vivo detected by In Vivo Imaging System. (K) Ex vivo detection of DiR signal in tumor tissues. (L) Analysis of DiR intensity in tumor tissues. Quantitative data are shown as mean±SEM (n=4). (A–D, I, J, L) Statistical analysis was determined by one-way analysis of variance with Bonferroni correction. (E–H) Statistical analysis was determined by Mann-Whitney U test. *P<0.05, **P<0.01, ***P<0.001. aCCR5, antibody against CCR5; Avg, average; CCL5, C-C chemokine ligand 5; CFSE, carboxyfluorescein succinimidyl ester; CM, complete medium; Ctr, control; DiR, dioctadecyl-3,3,3′,3′-tetramethylindotricarbocyanine iodide; Exos, exosomes derived from γδ-T cells; MFI, median fluorescence intensity; NPC, nasopharyngeal carcinoma; NS, not significant; SN, supernatant.

