
Figure 4.
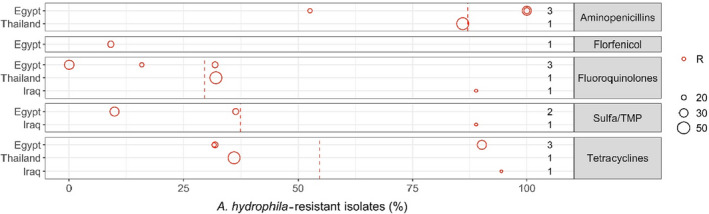
Aeromonas hydrophila resistance data for each included study sorted by country
- Each circle represents one study, and the size of each circle reflects how many isolates were included in the study. The colour of a circle illustrates resistance (red circle). The dashed lines indicate, for each antimicrobial, the weighted arithmetic mean of %R. The exact percentages that these lines represent are listed in Appendix C. Numbers written to the left of antimicrobial names reflect the number of studies for a certain drug/country combination.