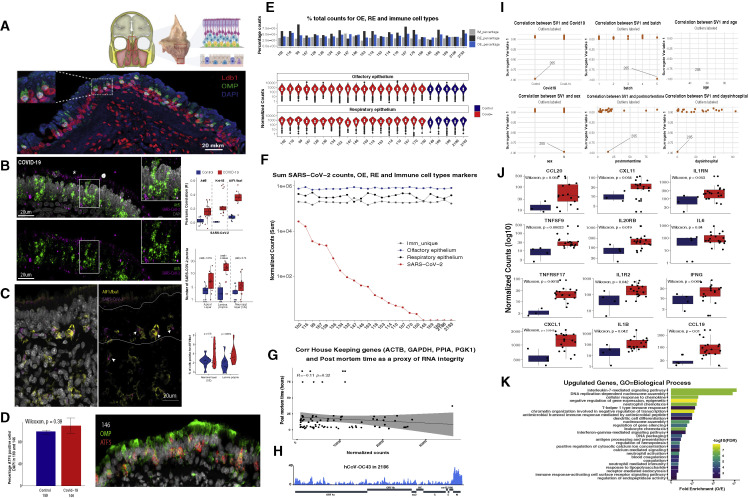
Figure S5.
Quality control analyses of human OE autopsies, related to Figure 6
(A) (Top) En bloc resection of the cribriform plate along with underlying mucosa from the olfactory cleft, which contains OE more superiorly and respiratory epithelium below. (Bottom) Section of this human olfactory epithelium stained for OMP (green) and LDB1 (red), OSN-specific and OSN-enriched markers, respectively. Nuclei are labeled with DAPI (blue).
(B) Confocal micrograph of RNA FISH for SARS-CoV-2 gRNA (magenta) and OSN/OSN progenitor marker ATF-5 (green) in COVID-19+ human OE. The SARS-CoV-2 probe targets the antisense strand of the S gene, detecting replicating virus. Nuclei are stained with DAPI. SARS-CoV-2 signal is detected in the apical layers of the epithelium (asterisk), proximal to SUS cells, and in the basal layer where HBCs reside. Correlation of the RNA-FISH SARS-CoV-2 signal and markers for OSNs (ATF5), sustentacular cells (Krt-18), and microglia (AIF1/Iba1) is measured by Pearson’s correlation coefficient (R) in COVID-19 (red) and control (blue) human OE autopsies (top right panel). Quantification of RNA-FISH signal was measured as local maxima at the apical, neuronal, and basal layers for a total of 2,140 cells in infected and 1,819 cells in control OEs. Only apical and basal layers have significantly enriched signal in infected OEs.
(C) RNA-FISH SARS-CoV-2 signal (magenta), detected in the neuronal layer (OE), marked in between the two white lines, and lamina propria. S probe signal (magenta) strongly correlates with microglia marker AIF1/Iba1 (yellow) immunofluorescence (IF) signal, as indicated by arrows. The number of AIF1/Iba1-positive cells is measured over the number of total cells counted (right panel). In COVID-19 patients, a significantly enrichment of microglia is observed in the lamina propria, while in the neuronal layer (OE), more variability between images is observed.
(D) Bar plot of the percentage of Atf5 RNA+ cells over total number of DAPI-positive cells on sections of COVID-19 (146) and control (189) human OEs. No significant difference between samples is detected (n = 508 for 146, n = 458 for 189). Cells with more than two RNA puncta were counted as positive. On the right, a representative image of sample 146 for Atf5 RNA-FISH (red) and OMP protein (green).
(E) Percentage of total counts of OE, RE, and immune-cell-type genes. Pairwise Wilcoxon test shows no significant difference between samples. Distribution of normalized counts for OE and RE genes for each sample (bottom panels).
(F) SARS-CoV-2 counts plotted in decreasing order (red) together with normalized counts for OE (blue), RE (black), and immune cells (gray).
(G) Correlation of house-keeping genes (ACTB, GAPDH, PPIA, and PGK1) and post-mortem times were used as a proxy of RNA integrity. Pearson’s test shows no significant correlation.
(H) Coverage map for hCoV-OC43 in sample 2,186.
(I) Surrogate variable analysis reveals sample 205 as an extreme outlier. SV1 does not correlate with known variables (COVID-19, processing batch, age, sex, post-mortem time, or days after symptoms onset), but rather in all cases distinguishes sample 205 from other samples.
(J) Box plot depicting normalized counts between pooled control and infected samples for antiviral genes.
(K) GO analysis for upregulated genes depicting significant enrichment for genes involved in immune/antiviral responses.

