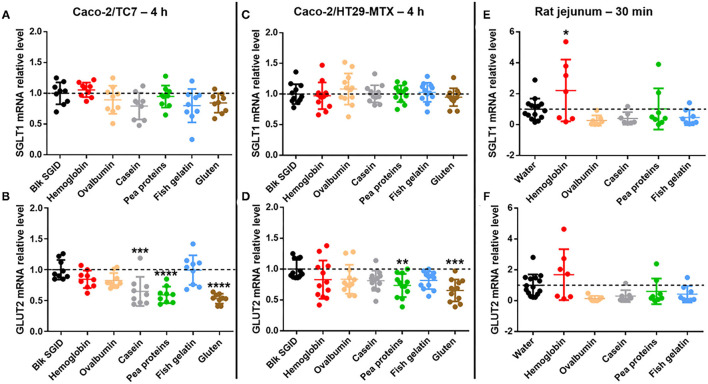
Figure 3.
Some digested dietary proteins decrease GLUT2 mRNA expression in vitro. (A,B) SGLT1 (A) and GLUT2 (B) mRNA relative levels normalized to TBP in Caco-2/TC7 cells incubated for 4 h with 5 mg/mL digested proteins (hemoglobin, ovalbumin, casein, pea proteins, fish gelatin, and gluten). Control condition (Blk SGID) is set at 1. Mean ± SD (***, p < 0.001 and ****, p < 0.0001 compared to control – one-way ANOVA followed by Dunnett's test). (C,D) SGLT1 (C) and GLUT2 (D) mRNA relative levels normalized to HPRT1 in Caco-2/HT29-MTX co-culture incubated for 4 h with 5 mg/ml digested proteins (hemoglobin, ovalbumin, casein, pea proteins, fish gelatin, and gluten). Control condition (Blk SGID) is set at 1. Mean ± SD (**, p < 0.01 and ***, p < 0.001 compared to control – one-way ANOVA followed by Dunnett's test). (E,F) SGLT1 (E) and GLUT2 (F) mRNA relative levels normalized to HPRT1 in rat jejunal scraped mucosa, 30 min after gavage with 1 g/kg of bodyweight of dietary proteins (hemoglobin, ovalbumin, casein, pea proteins, and fish gelatin). Control condition (water) is set at 1. Mean ± SD (*, p < 0.05 compared to control – one-way ANOVA followed by Dunnett's test).

