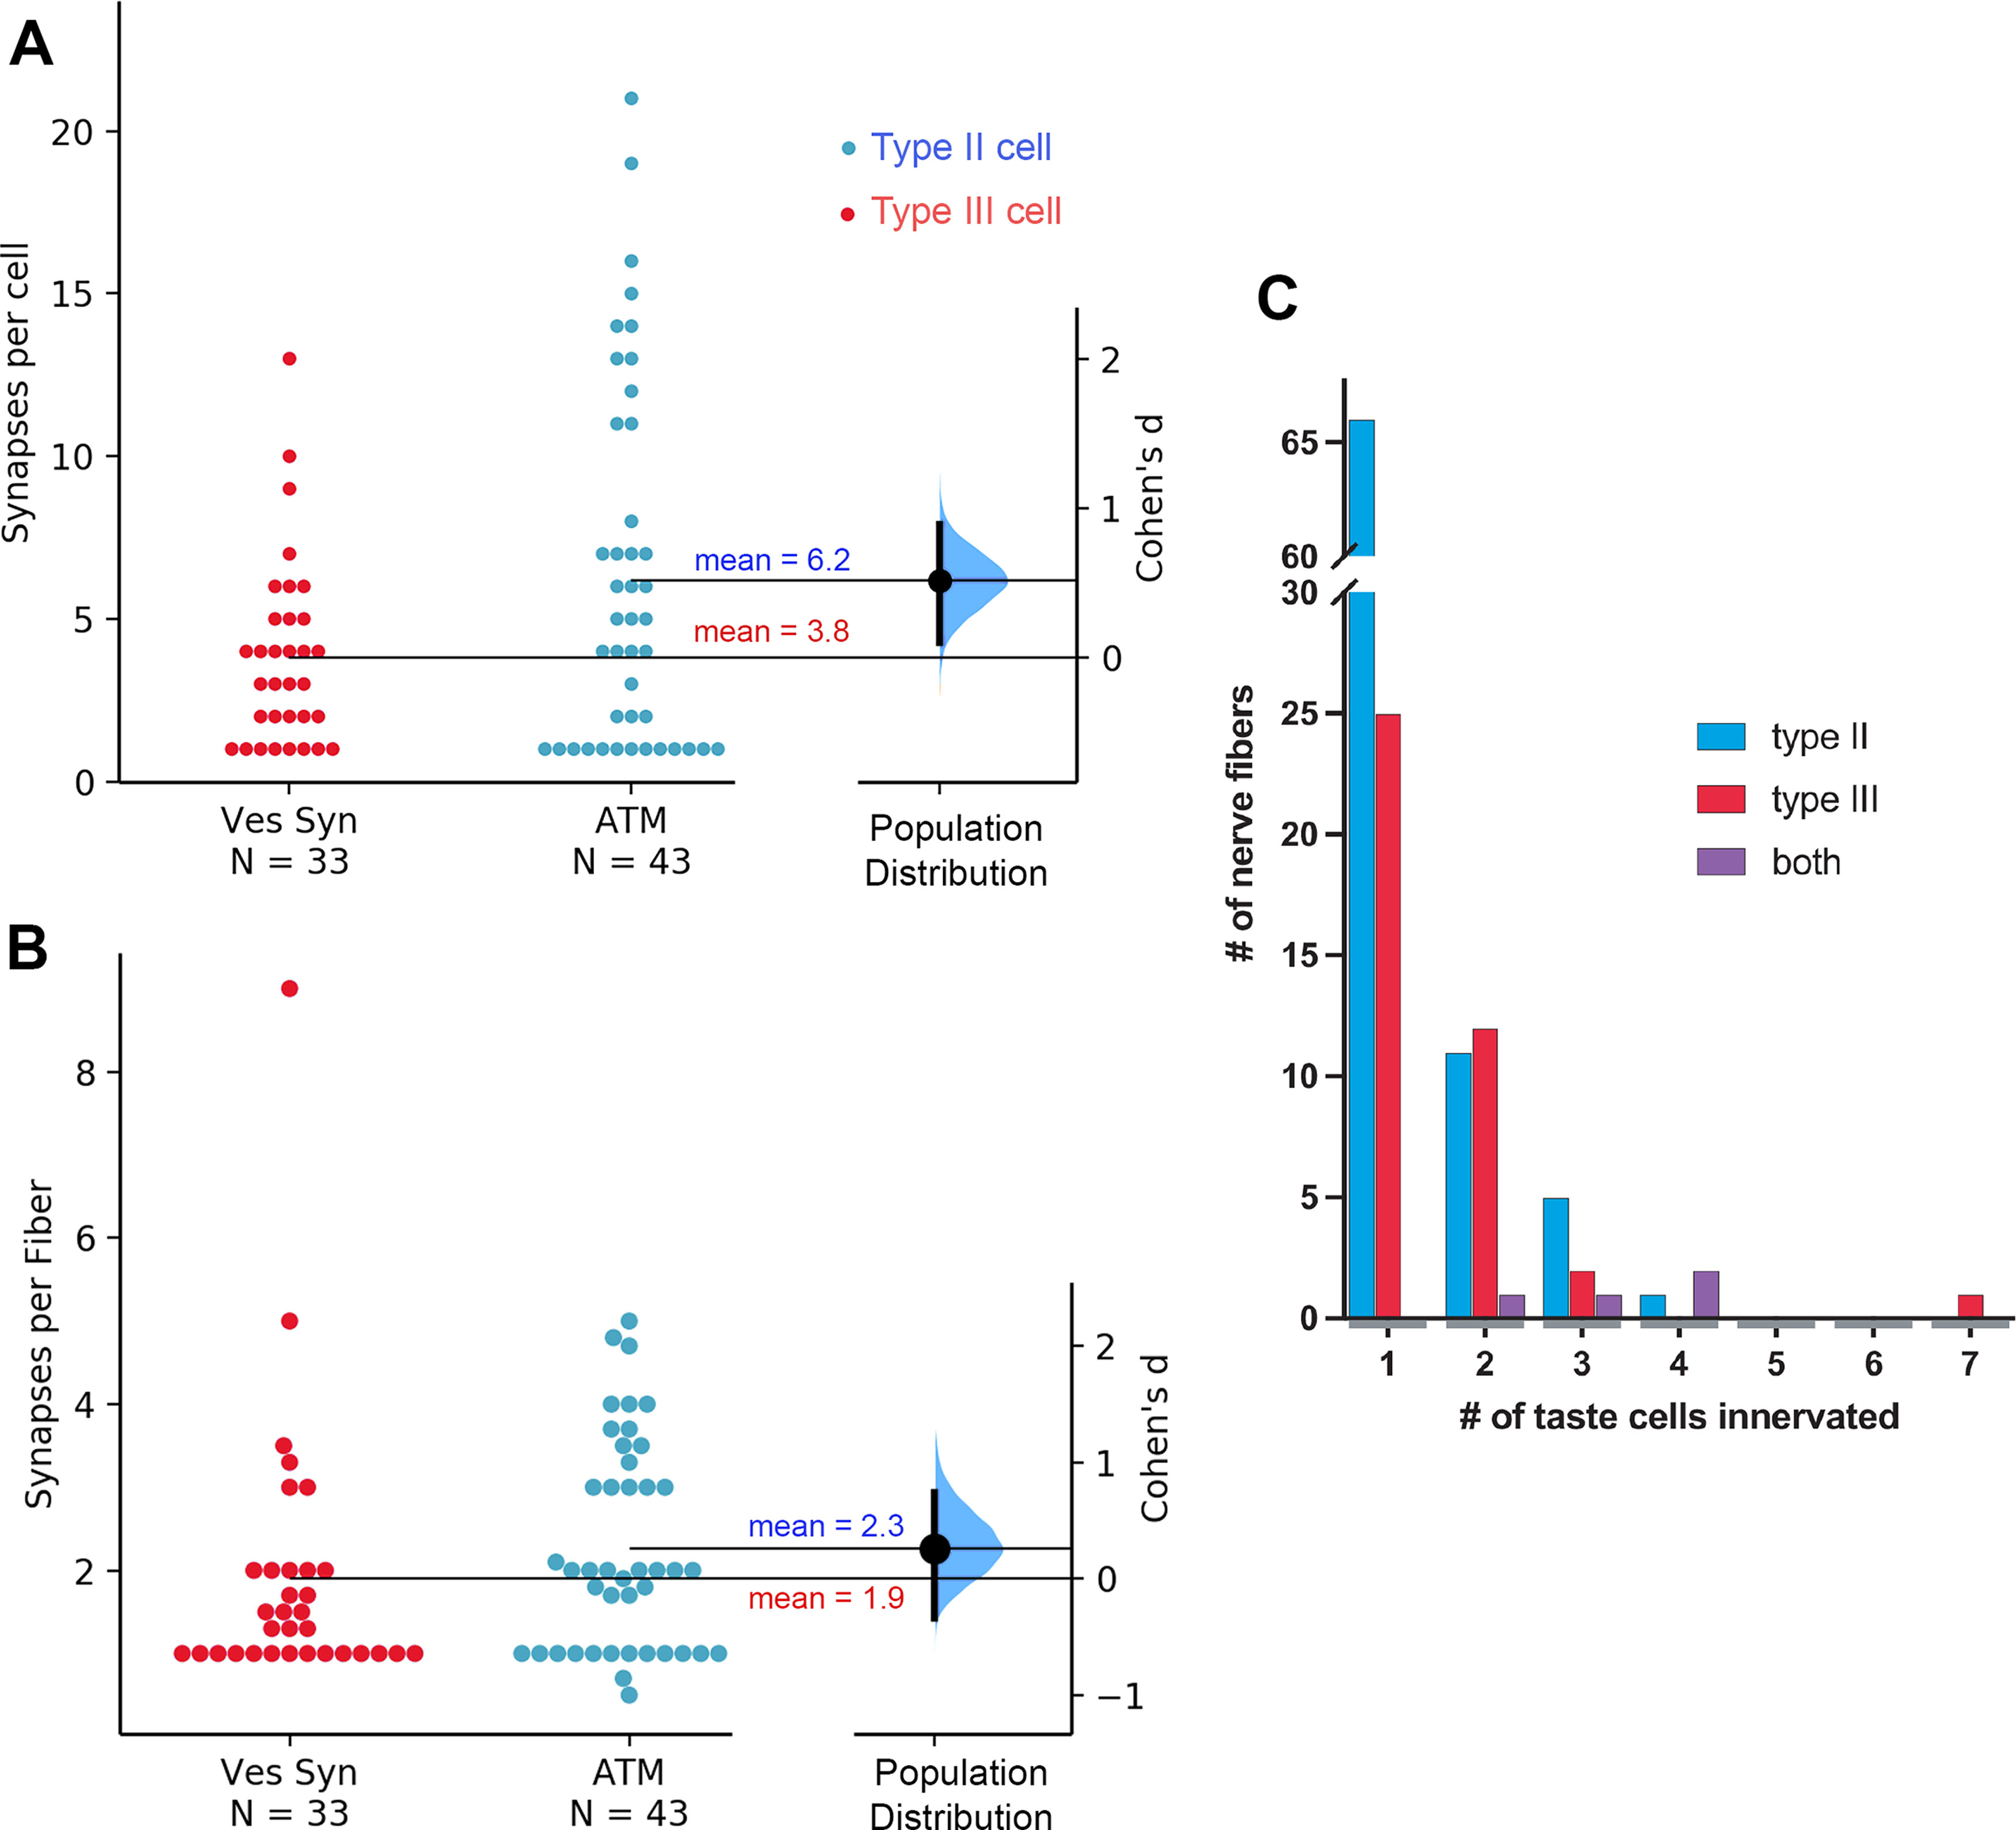
Figure 8.

A, The mean number of synapses per cell is larger for Type II cells (ATM) than for Type III cells (Ves Syn). The Cohen's d between Ves Syn and ATM is shown in this Gardner–Altman estimation plot. Both groups are plotted on the left axes; the mean difference is plotted on a floating axis on the right as a bootstrap sampling distribution. The mean difference is depicted as a large dot; the 95% confidence interval is indicated by the ends of the vertical error bar. B, Similar plot showing no significant difference between average number of synapses per fiber for Type II (ATM) and Type III (Ves Syn) cell synapses. C, Histogram showing how many NFs innervate different numbers of taste cells. Number of NFs innervating Type II cells are in blue, those innervating Type III cells are in red, and those innervating both Type II and Type III cells are in purple.
