Figure 1.
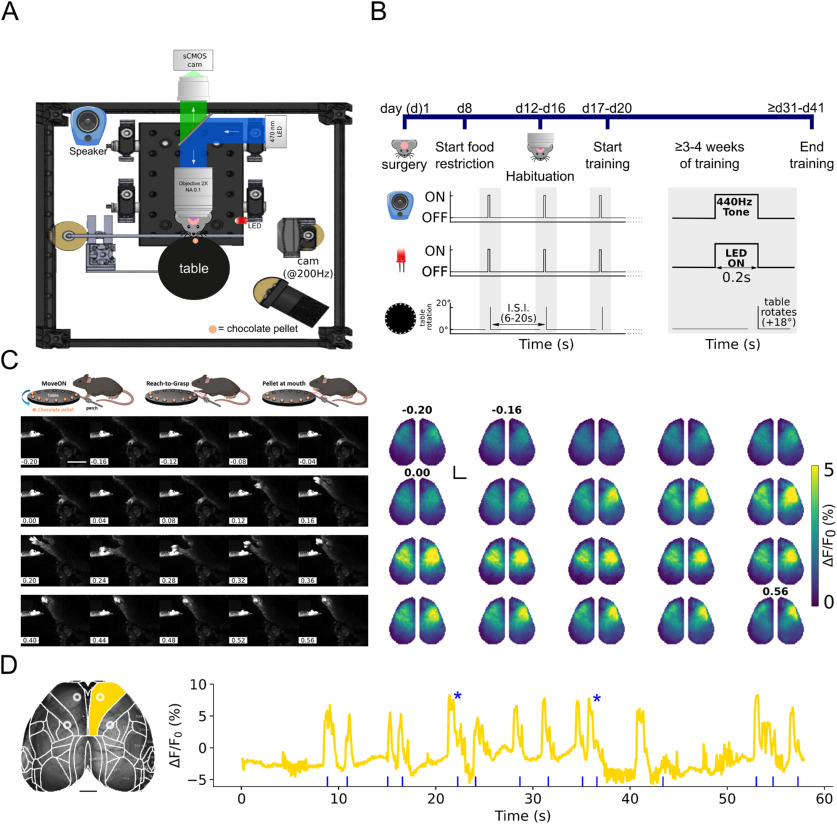
Mesoscale imaging of neocortical dynamics during RtGs. A, Experimental setup. Schematics of the experimental setup, which comprises a custom-made widefield microscope to acquire images, 512 × 512 pixels, from the intact skull of GCaMP6f transgenic mice with a sampling rate of 25 Hz. Behavioral data were obtained via a high-speed (200 fps) camera placed on the left side of the head-fixed animal. Chocolate pellets were used to induce voluntary RtG movements. A turntable attached to a servo-motor was used for pellet delivery. All components of the experimental setup were synchronized by using a common TTL trigger. B, Experimental timeline. Mice underwent surgery to expose the skull and head-bar implantation. Following recovery from surgery (∼1 week), mice were food-restricted to 80%-90% of their baseline body weight and habituated to the experimental setup for at least 4 d (30 min a day/mouse). After habituation, mice were gently placed under the microscope and head-fixed below the objective. Training consisted of daily sessions (30-45 min/session) and lasted at least 3-4 weeks (5 sessions/wk). Each session consisted of several (at least 3) blocks, during which tones (square wave at 440 Hz) preceded by 200 ms the rotation of the turntable. Interstimulus interval (ISI) was between 6 and 20 s. C, Mesoscale cortical activity during a single RtG movement. Top, Illustration of the movement sequence, that is, the onset of the RtG (MoveOn, left), the RtG (middle), and the finishing sequence of the RtG, when the pellet is brought to the mouth (pellet at mouth, right). Left, Image sequence of a mouse performing a successful RtG with the left forelimb. Right, Image sequence of cortical activity during the same perimovement epoch (between −0.2 and 0.56 s relative to the movement onset, sampling time 40 ms). Color bar (viridis) represents the range of ΔF/F0 (%). In this case, the movement lasts ∼560 ms. Black dot represents bregma. Activity increases in both hemispheres during early phases of movement, while later increased activity is localized in the contralateral sensorimotor areas. Scale bar, 2 mm. D, Neural activity in the right primary motor cortex is associated with repeated RtGs. Left, Image represents the typical FOV obtained during recordings. The Allen Mouse Brain Atlas mask was applied on the fluorescence image stacks to parcellate the signals according to the cortical areas of interest. For each hemisphere, areas of interest also included the RFA (top left ring and top right ring) and the CFA (bottom left ring and bottom right ring). Scale bar, 1 mm. Right, Graph represents the fluorescent and movement signals. ΔF/F0 (%) extracted from the right primary motor cortex (gold-colored trace). Blue rasterplot represents onsets of RtG movements. Increased activity in the selected cortical area is observed for each RtG attempt. Asterisks identify successful RtGs.

