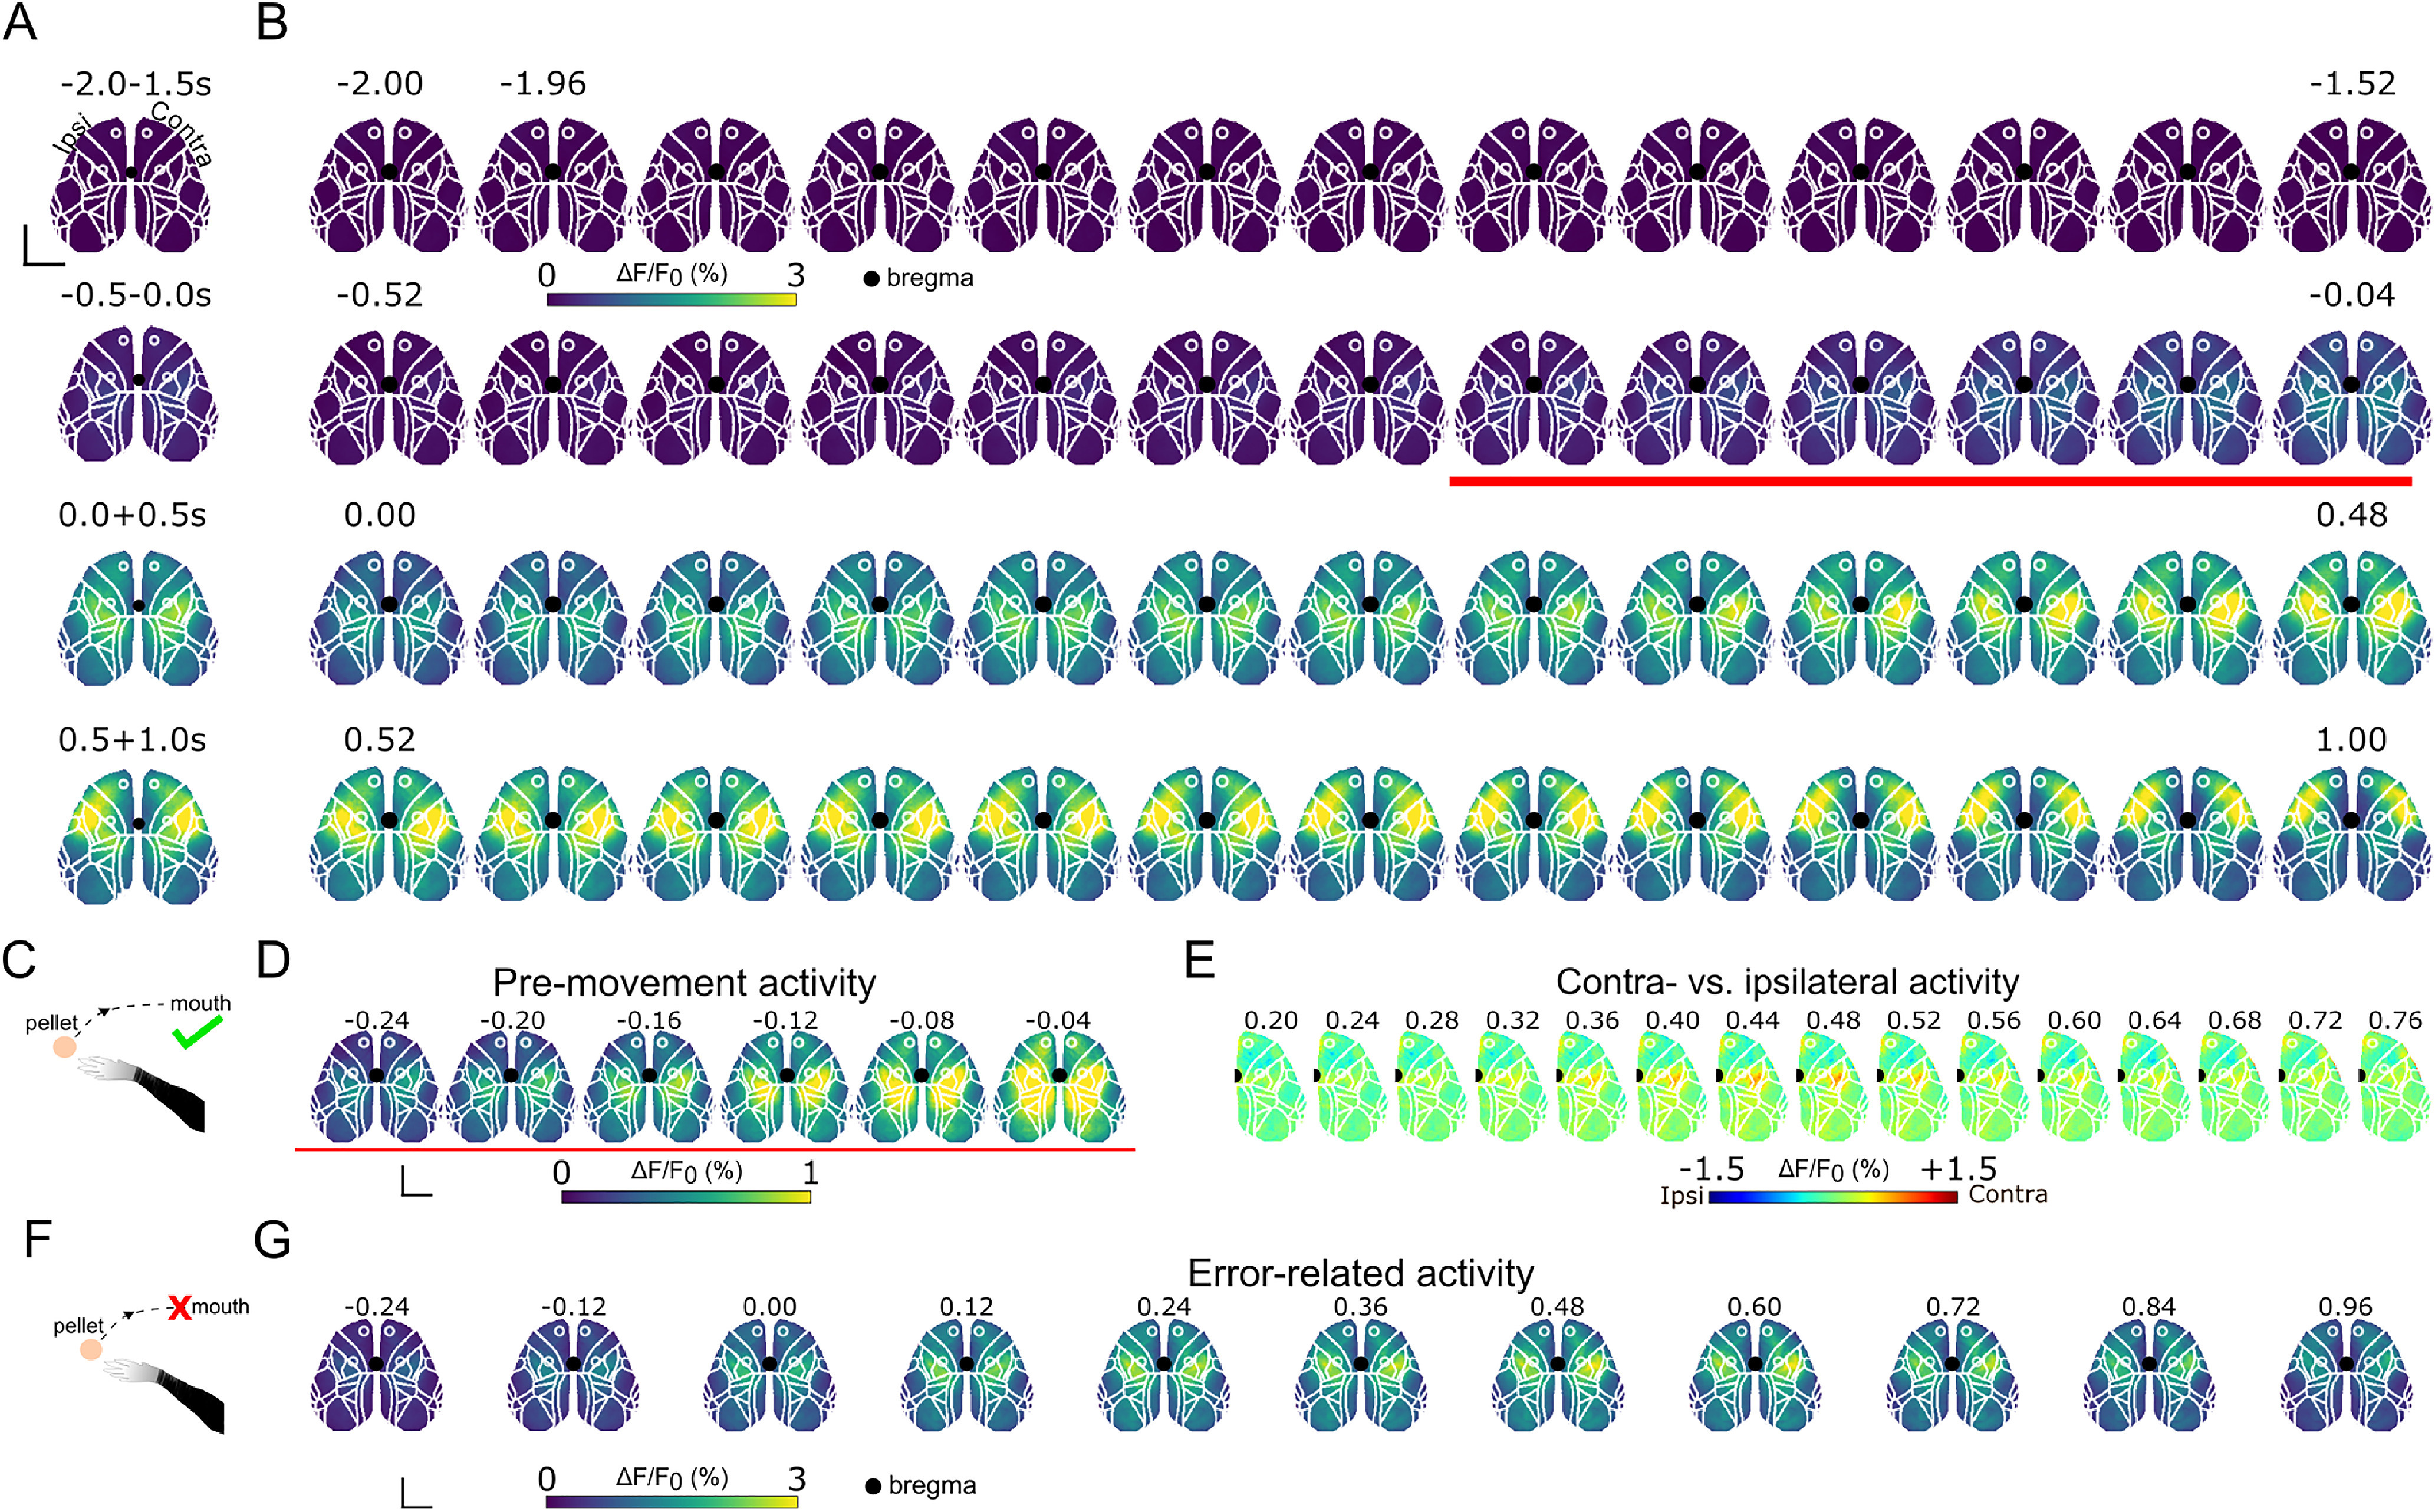
Figure 2.

Single-pixel analysis of neocortex-wide activity during successful and error RtGs. A, Top, Averaged activity across the temporal windows −2, −1.5 s; −0.5, −0.04 s; 0, 0.5 s; and 0.5-1 s relative to MoveON. Black dot represents bregma. Scale bar, 2 mm. B, Perievent (−2 + 2 s with respect to MoveON) image sequence for successful RtGs. Images represent the average signal obtained from aligned stacks of all subjects, for all perimovement epochs (n = 78 movements, 6 mice). On average, activity increases before movement onset in medial regions of the cortex and spreads mediolaterally thereafter (images above the red line, and in D). This increase involves areas of both hemispheres. Color bar (viridis) represents the range of ΔF/F0 (%). C, Diagram represents a successful RtG (i.e., an RtG that does end with the pellet eaten). D, Premovement activity starts in medial areas and spreads laterally during RtGs. Scale bar, 2 mm. E, Contralateral versus ipsilateral activity across the neocortex during successful RtGs. Neocortex-wide activity is compared between the ipsilateral and contralateral hemispheres. Perievent (0.20 + 0.76 s with respect to MoveON) image sequence for successful RtGs. Images represent the average signal obtained from aligned stacks of all subjects, for all perimovement epochs (n = 78 movements, 6 mice). On average, activity appears distributed across both hemispheres. A pronounced bias toward the contralateral hemisphere emerges around the RFA and around the SSp-ul and part of the CFA and SSp-ll, from 0.36 to 0.56 s after MoveON. Color bar (jet) represents the range of ΔF/F0 (%). F, Diagram represents an error RtG (i.e., an RtG that does not end with the pellet eaten). G, Perievent (−0.24 + 0.96 s with respect to MoveON) image sequence for error RtGs. Images represent the average signal obtained from aligned stacks of all subjects, for all perimovement epochs (n = 113 movements, 6 mice). In error RtGs, compared with successful RtGs, during the latter phase of movement execution, the activity does not involve lateral areas across both hemispheres. Color bar (viridis) represents the range of ΔF/F0 (%). Scale bar, 2 mm. Time is in seconds (s) for all image sequences.
