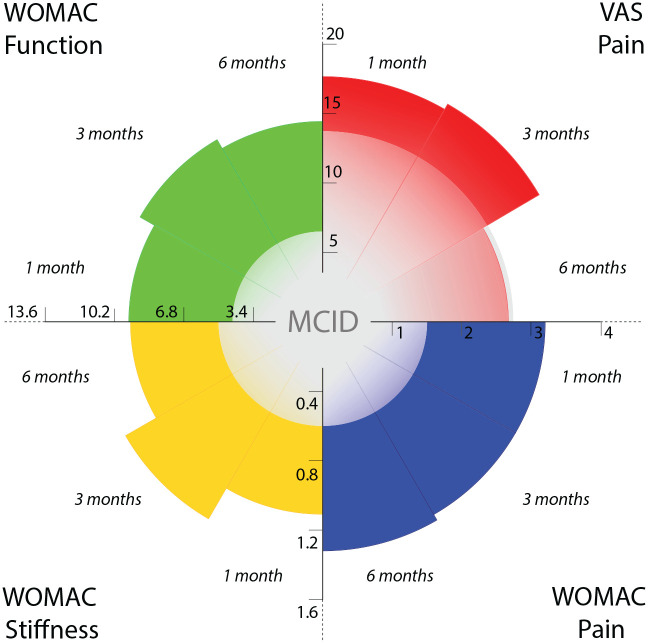
Figure 2.
Effect of placebo injection. The results of the meta-analysis in terms of VAS pain (0-100), WOMAC-pain (0-20), WOMAC-stiffness (0-8), and WOMAC-function (0-68) at the different follow-ups (1 month, 3 months, 6 months) are compared to the previously reported MCID. Every quadrant reports data about one of the evaluated outcomes whereas axes report the related scale: VAS pain (upper right), WOMAC-pain (bottom right), WOMAC-stiffness (bottom left), and WOMAC function (upper left). The level of the documented improvement is represented by the colored area (red for VAS pain, blue for WOMAC pain, yellow for WOMAC stiffness, green for WOMAC function), whereas the level of the central gray area represents the previously reported MCID for each outcome. All the improvements at all the follow-ups go beyond the previously reported MCID, except for VAS-pain at the 6-month follow-up.

