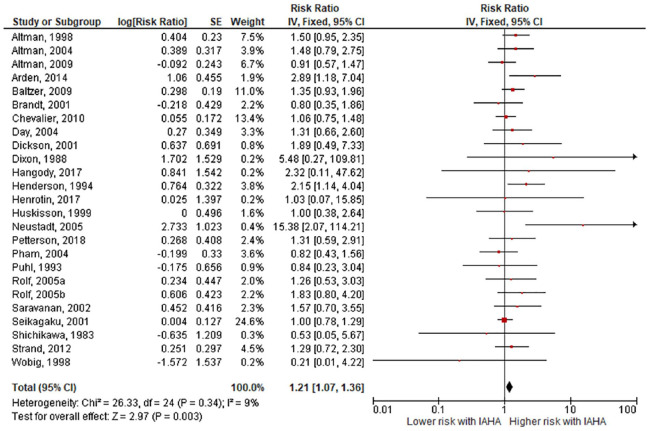
Figure 7.
Forest plot of pooled risk ratio for local adverse events with hyaluronic acid (HA) or saline injections. The risk ratio and 95% confidence interval are plotted for each study. The size of the square is proportional to the sample size of the study. The pooled risk ratio is denoted by the diamond apex and 95% confidence interval denoted by the diamond width. A pooled risk ratio of more than 1 indicates higher risk with HA. A pooled risk ratio of less than 1 indicates lower risk with HA. Heterogeneity: I2 = 9%, P = 0.34. Publication bias: Egger’s P = 0.12.

