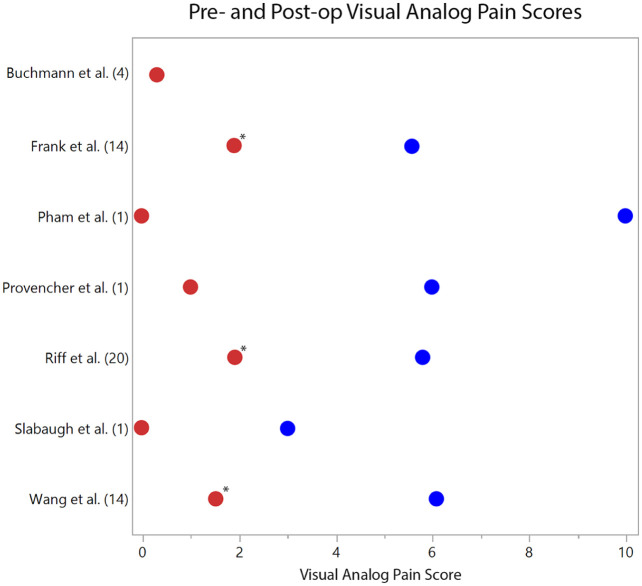
Figure 2.
Pre- (blue dots) and postoperative (red dots) visual analogue scale (VAS) pain scores on a scale of 0 to 10, with 0 being no pain and 10 being the most. The respective studies are listed with their cohort size (n). *Statistically significant improvement in VAS scores (P < 0.05) is denoted when provided by the study.

