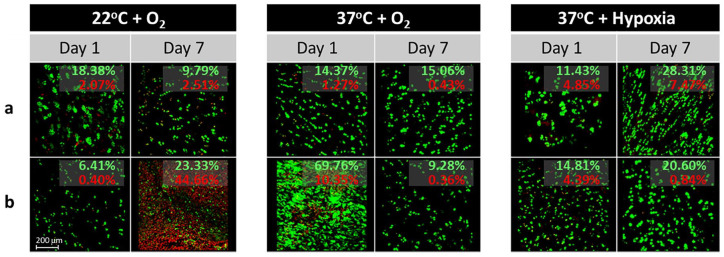
Figure 5.
Representative live/dead staining of cartilage discs. Representative images from 5 different cartilage discs (a-e, collected from a single donor) obtained during live/dead microscopy at days 1 and 7 following storage at various temperature and oxygen conditions. Samples stored at 22°C demonstrated significantly decreased proportions of live (green) cells at day 7 compared with baseline (day 1) and matching samples stored at 37°C. Green (red) values represent the percentage of all pixels that are green (red).

