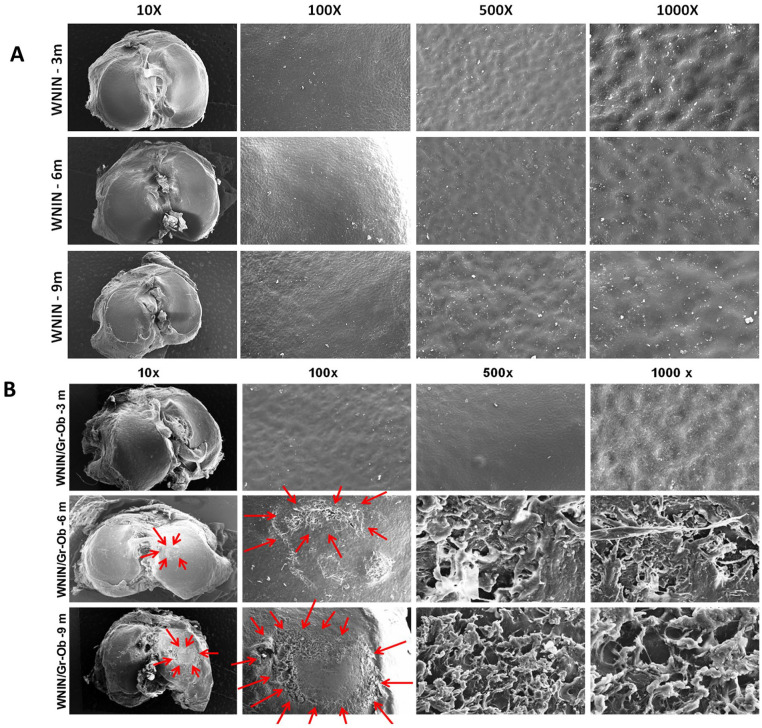
Figure 5.
Scanning electron microscopy (SEM) assessment of tibial cartilage surface. (A) Representative SEM micrographs of WNIN rat tibial surfaces at 3, 6, and 9 months at different magnifications. (B) Representative SEM micrographs of WNIN/Gr-Ob rat tibial surfaces at 3, 6, and 9 months. The micrographs were captured at various magnifications (10×, 100×, 500×, and 1000×) (n = 3).

