
Fig. 8.
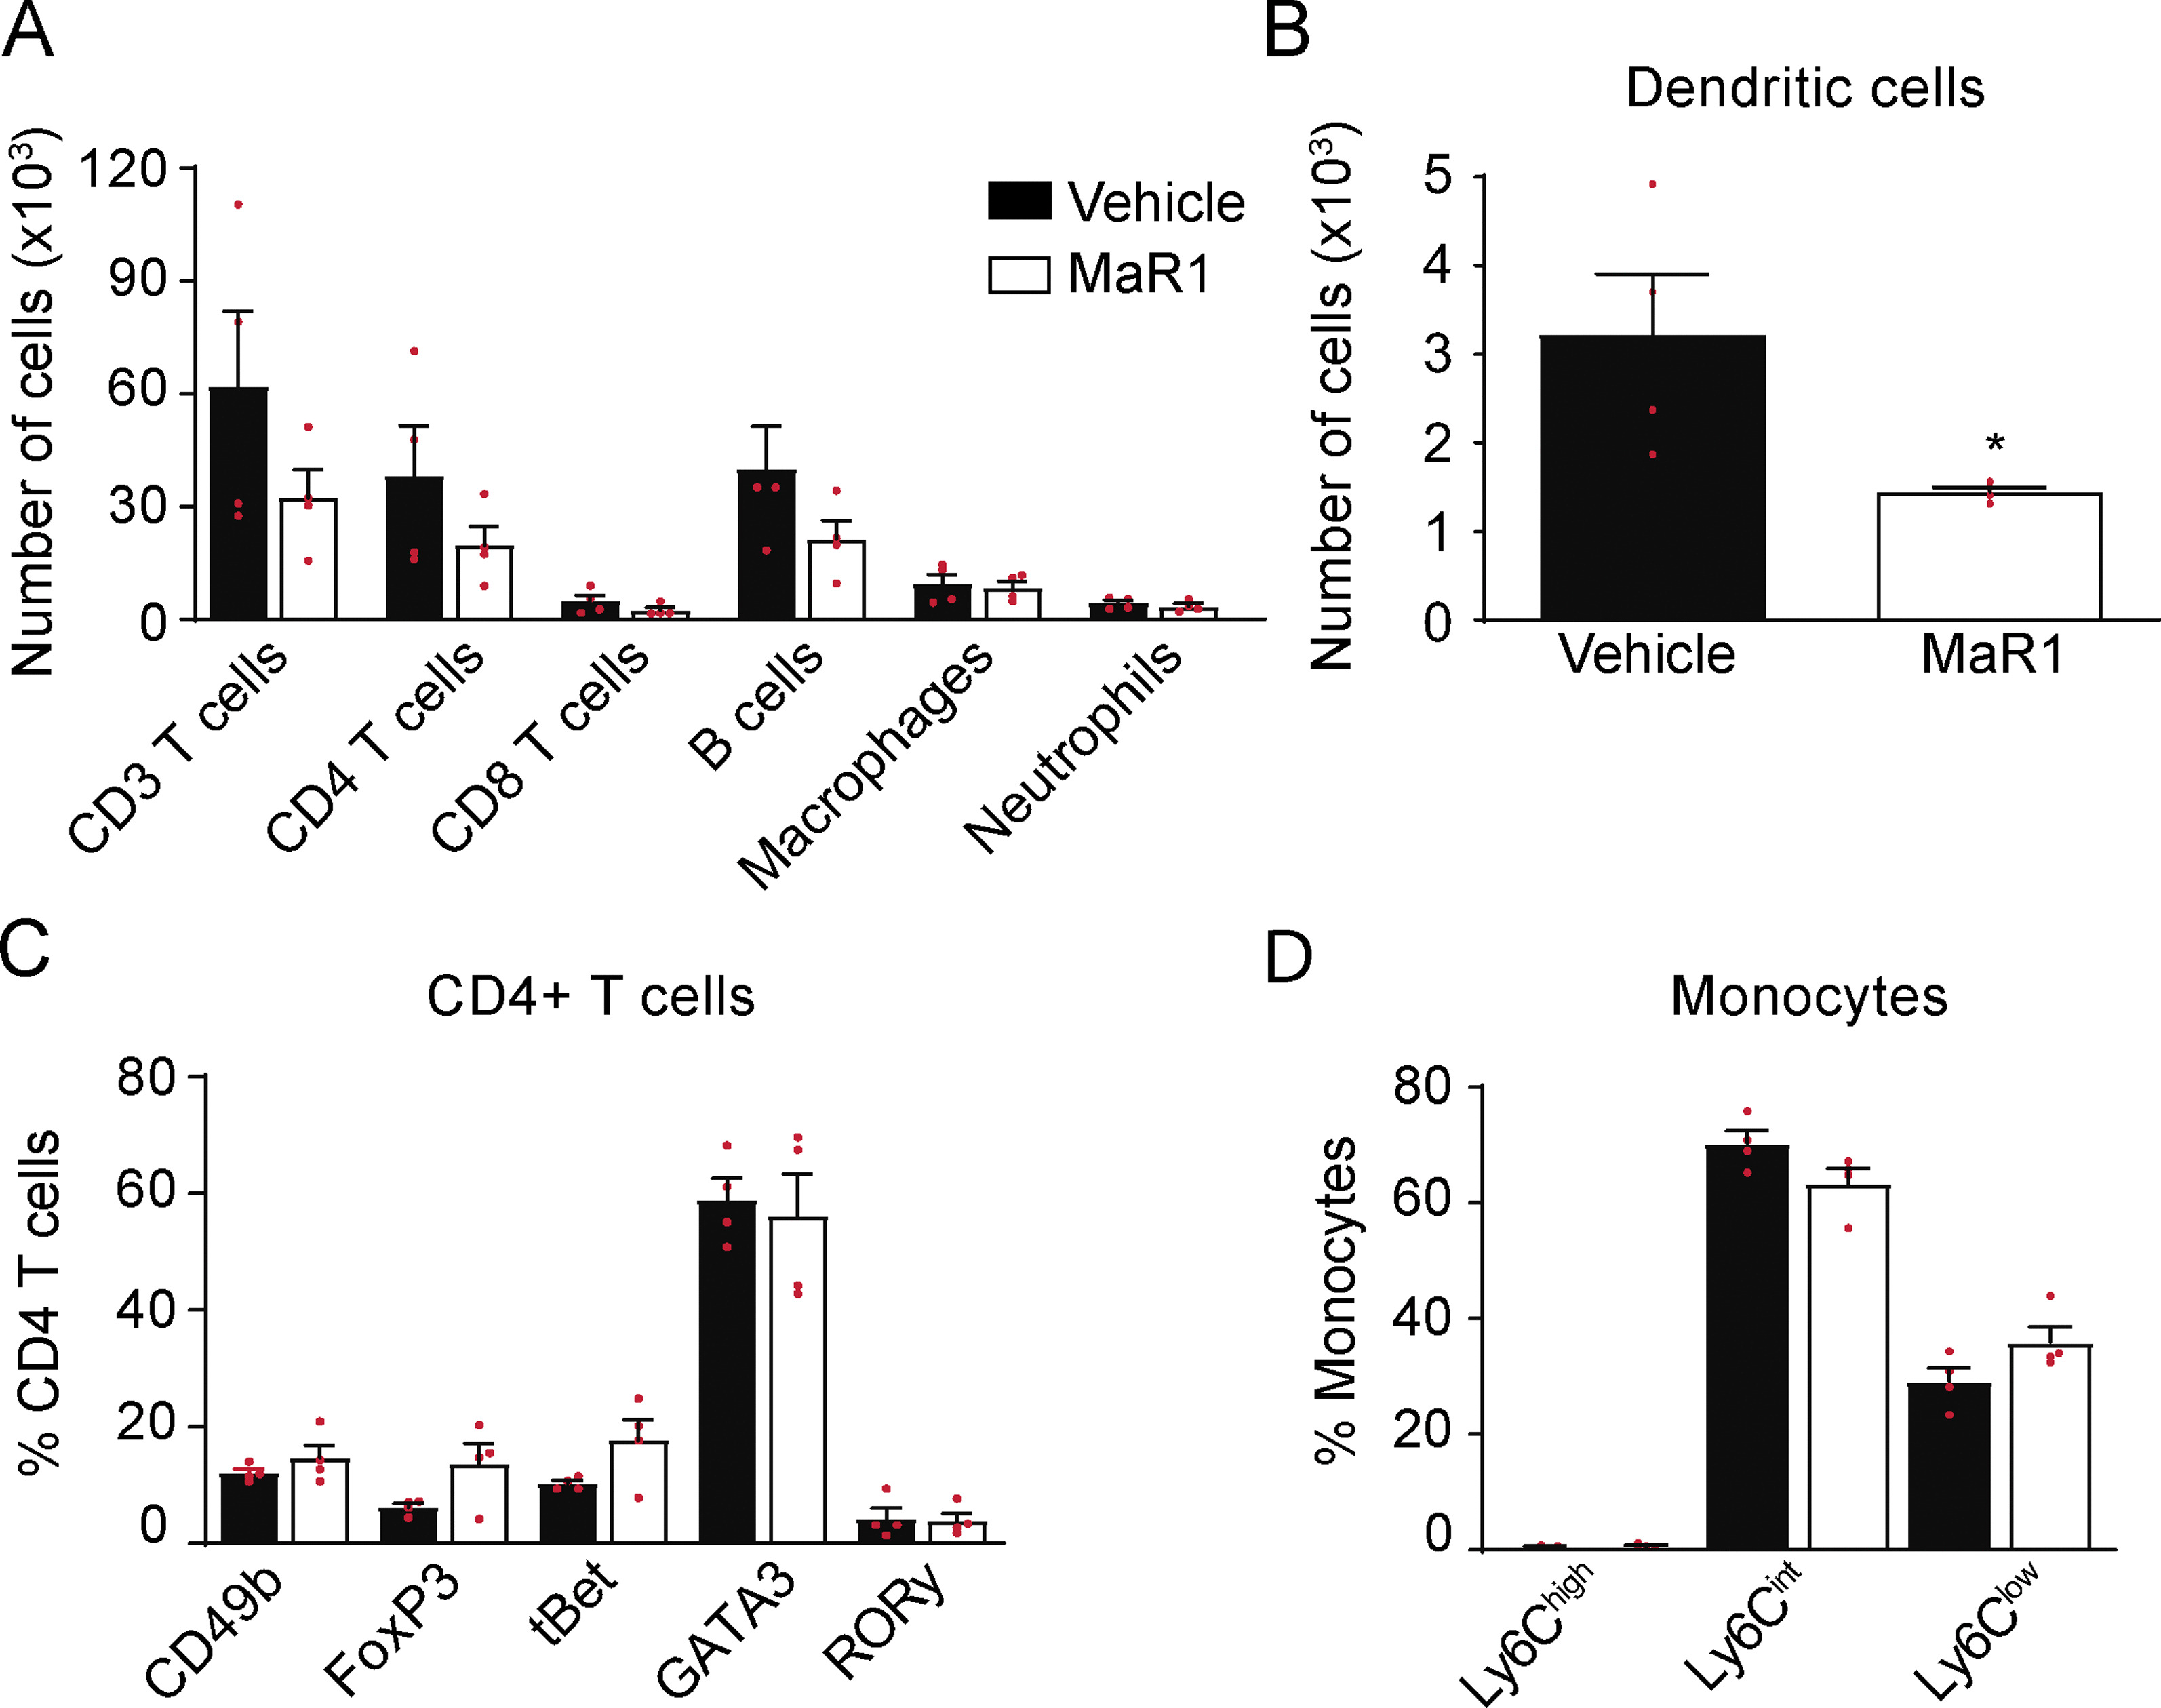
Effects of MaR1 on immune cells in the lymph nodes at the peak of EAE. A Graph showing the quantification of different leukocytes populations and dendritic cells B in the lymph nodes of MaR1- or vehicle-treated mice. C Plot showing the percentage of CD4 + T cells expressing the transcription factors CD49b, FoxP3, tBet, GATA3 or RORγ and the cell numbers for the different macrophage subsets according to Ly6C expression D in the lymph nodes of MaR1- or vehicle-treated mice. Unpaired t-test (n = 4 per group). Data are shown as mean ± SEM