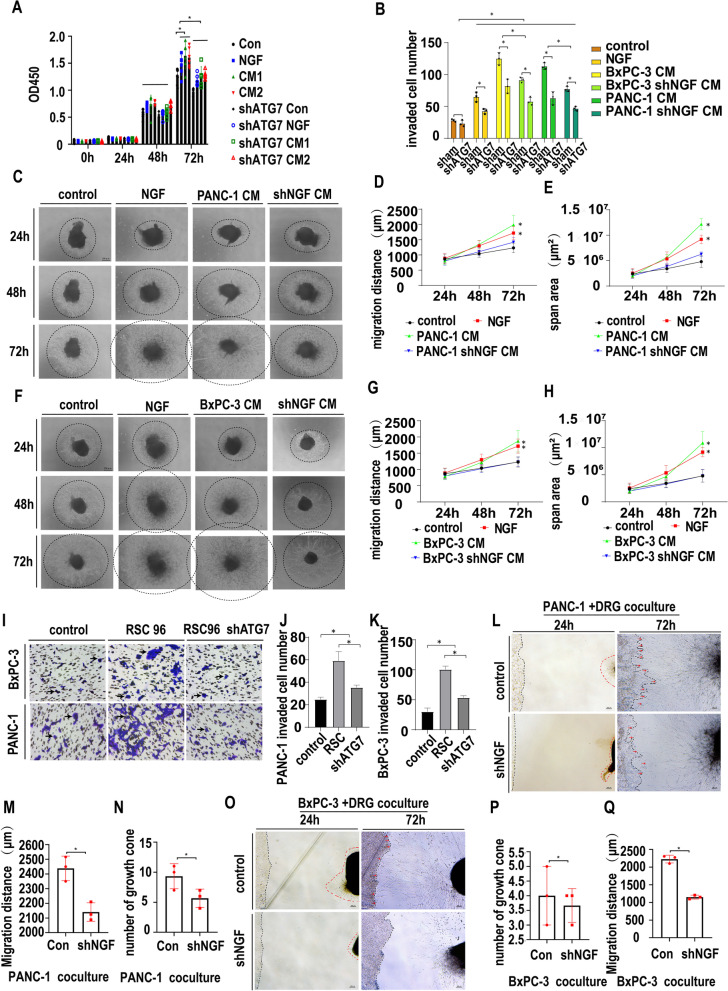
Fig. 3.
NGF-induced autophagy promotes the proliferation and migration of SCs. A. CCK-8 proliferation assays of RSC96 and shATG7-RSC96 cells treated with the control, NGF or PanCa CM. OD 450 nm value was determined at 0 h, 24 h, 48 h and 72 h (* p < 0.05).NGF or PanCa CM could promote RSC96 proliferation at 72 h. Knocking down ATG7 on RSC96 could partially reverse the effect. B. Transwell migration assays of RSC96 and shATG7-RSC96 cells treated with the control or NGF, PanCa CM or shNGF-PanCa CM (* p < 0.05). NGF or PanCa CM could promote RSC96 migration at 24 h. Knocking down ATG7 on RSC96 or knocking down NGF on PanCa could partially reverse the effect. C. Dorsal root ganglion monoculture with the control, NGF, PANC-1 CM or shNGF-PANC-1 CM. Light microscopy images were collected at 24 h, 48 h, and 72 h. Dashes indicate the neurofilament scope. D. Statistics of the migration distance (μm) of DRG neurofilaments treated with the control, NGF, PANC-1 CM or shNGF-PANC-1 CM (* p < 0.05). E. Statistics of the migration span (μm2) of DRG neurofilaments treated with the control, NGF, PANC-1 CM or shNGF-PANC-1 CM (* p < 0.05). F. Dorsal root ganglion monoculture with the control, NGF, BxPC-3 CM or shNGF-BxPC-3 CM. Light microscopy images were collected at 24 h, 48 h, and 72 h. Dashes indicate the neurofilament scope. G. Statistics of the migration distance (μm) of DRG neurofilaments treated with the control, NGF, BxPC-3 CM or shNGF-BxPC-3 CM (* p < 0.05). H. Statistics of the migration span (μm2) of DRG neurofilaments treated with the control, NGF, BxPC-3 CM or shNGF-BxPC-3 CM (* p < 0.05). I. Transwell migration assay for BxPC-3 and PANC-1 cells. PANC-1 or BxPC-3 cells were seeded in the upper chamber with 1% serum. No cell, normal RSC96 or shATG7-RSC96 cells in the lower chamber (10% serum were added) as chemoattractants. RSC96 as chemoattractans could promote PanCa cell migration ability while inhibiting RSC96 autophagy by knocking down ATG7 could partially reverse the effect. J. Statistics of migrated cells treated with the control, NGF, PANC-1 CM or shNGF-PANC-1 CM (cell image: Fig. 3I, PANC-1) (* p < 0.05). K. Statistics of migrated cells treated with the control, NGF, BxPC-3 CM or shNGF-BxPC-3 CM (cell image: Fig. 3I, BxPC-3) (* p < 0.05). L. DRGs were co-cultured with PANC-1 or shNGF-PANC-1 cells. Black dashes indicate the cancer line margin. Red dashes indicate the DRG neurofilament margin. Red arrow: cancer cell growth cone toward DRG. M. Statistics of the migration distance (μm) of DRG-derived Schwann cells toward cancer cells (cell image: Fig. 3L) (* p < 0.05). N. Statistics of growth cone numbers of PANC-1 cells toward DRG (cell image: Fig. 3L) (* p < 0.05). O. DRGs were co-cultured with BxPC-3 or shNGF-BxPC-3 cells. Black dashes indicates the cancer line margin. Red dashes indicates the DRG neurofilament margin. Red arrow: cancer cell growth cone toward the DRG. P. Statistics of growth cone numbers of BxPC-3 cells toward the DRG (cell image: Fig. 3O) (* p < 0.05). Q. Statistics of the migration distance (μm) of DRG-derived Schwann cells toward cancer cells (cell image: Fig. 3O) (* p < 0.05)

