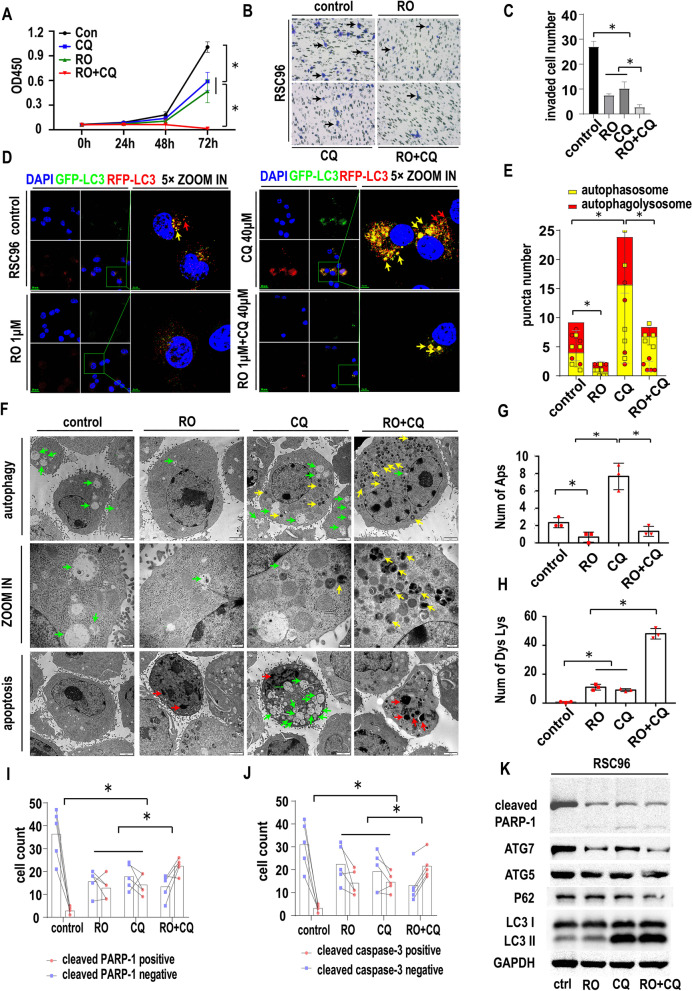
Fig. 4.
The effect of double targeting of NGF and autophagy on SCs. A. CCK-8 proliferation assays of RSC96 cells treated with the control, RO 08–2750 (RO) (1 μM), chloroquine (CQ) (40 μM) or RO + CQ (1 μM + 40 μM). The OD 450 nm value was determined at 0 h, 24 h, 48 h, and 72 h (* p < 0.05). B. Transwell migration assays of RSC96 cells treated with the control, RO, CQ or RO + CQ.RSC96 were seeded in the upper chamber with 1% serum and the indicated drugs. The lower chamber were 10% serum culture medium. C. Statistics of migrated RSC96 cells treated with the control, RO, CQ or RO + CQ (cell image: Fig. 4B) (* p < 0.05). D. Autophagic flux detection of RSC96 treated with the control, RO, CQ or RO + CQ at 24 h. LC3 labeled with GFP (green) and RFP (red) and merged as yellow. Red arrow: autophagolysosomes. Yellow arrow: autophagosome. RO treatment could reduce both autophagolysosomes and autophagosomes. CQ treatment could increase both autophagolysosomes and autophagosomes. CQ treatment could also increase the ratio of autophagosomes to autophagolysosomes. RO + CQ treatment could increase the ratio of autophagosomes to autophagolysosomes compared with control. RO + CQ treatment could reduce autophagolysosomes and autophagosomes compared with single CQ group. E. Statistics of red and yellow puncta number in RSC96 cells treated with the control, RO, CQ or RO + CQ (cell image: Fig. 4D) (* p < 0.05). F. TEM image of RSC96 cells treated with RO, CQ or RO + CQ at 24 h. Autophagy and apoptosis signs were detected. Green arrow: autophagosome. Red arrow: apoptosis sign. Yellow arrow: dysfunctional lysosome (CQ inhibits the lysosome function and the dysfunctional lysosomes are condensed and shows high density in TEM image). G. Statistics of autophagosome numbers of RSC96 cells treated with RO, CQ or RO + CQ (cell image: Fig. 4F) (* p < 0.05). H. Statistics of dysfunctional lysosome numbers of RSC96 cells treated with RO, CQ or RO + CQ (cell image: Fig. 4F) (* p < 0.05). I. Statistics of cleaved PARP1-positive and cleaved PARP1-negative RSC96 cell numbers treated with the control, RO, CQ or RO + CQ (cell image: Fig. S4D) (* p < 0.05). J. Statistics of cleaved caspase-3-positive and cleaved caspase-3-negative RSC96 cell numbers treated with the control, RO, CQ or RO + CQ (cell image: Fig. S4D) (* p < 0.05). K. Western blotting of RSC96 cells treated with RO, CQ or RO + CQ. GAPDH was used as a loading control. RO, CQ or RO + CQ could induce the expression of cleaved PARP-1. RO, CQ or RO + CQ could inhibit ATG7 expression in RSC96 while could not influence ATG5. RO could inhibit LC3II formation while CQ or RO + CQ could promote LC3II accumulation

