Fig. 5.
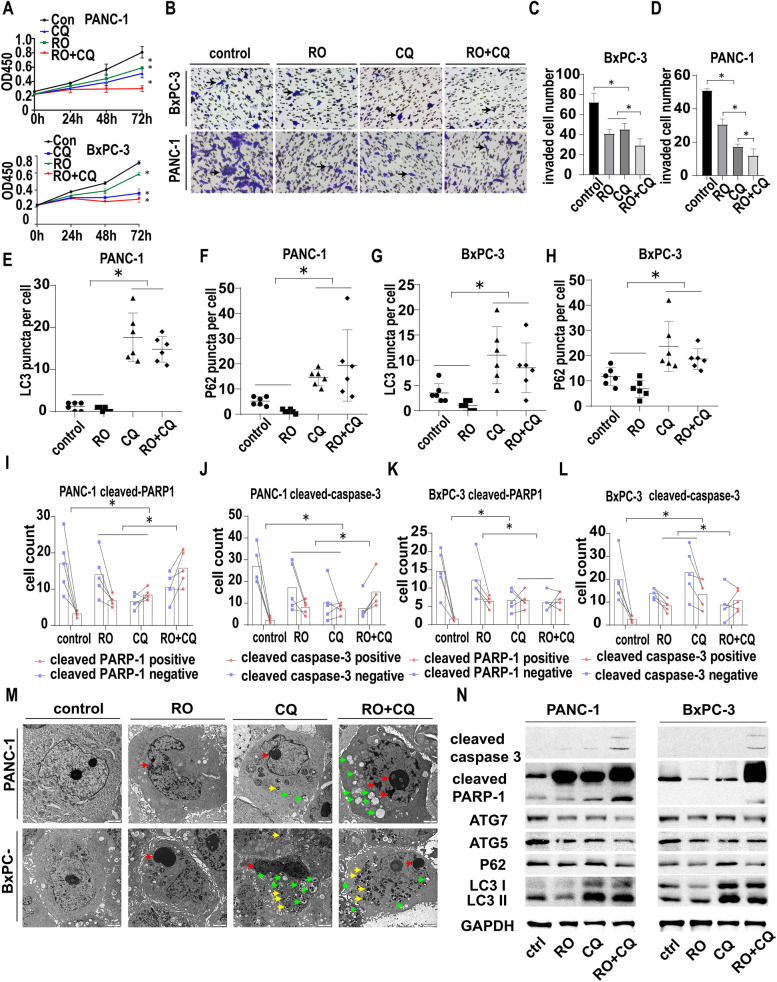
The effect of double targeting of NGF and autophagy on cancer cells. A. CCK-8 proliferation assay of PANC-1 and BxPC-3 cells treated with the control, RO (1 μM), CQ (40 μM) or RO + CQ (1 μM + 40 μM). The OD 450 nm value was determined at 0 h, 24 h, 48 h and 72 h (* p < 0.05). B. Transwell migration assay of PANC-1 and BxPC-3 cells treated with the control, RO (1 μM), CQ (40 μM) or RO + CQ (1 μM + 40 μM) at 24 h. PANC-1 or BxPC-3 were seeded in the upper chamber with 1% serum and the indicated drugs. The lower chamber were 10% serum culture medium. Black arrow: migrated cell. C. Statistics of migrated BxPC-3 cells treated with the control, RO (1 μM), CQ (40 μM) or RO + CQ (1 μM + 40 μM) (cell image: Fig. 5B) (* p < 0.05). D. Statistics of migrated PANC-1 cells treated with the control, RO (1 μM), CQ (40 μM) or RO + CQ (1 μM + 40 μM) (cell image: Fig. 5B) (* p < 0.05). E. Statistics of LC3 puncta number in PANC-1 cells treated with control, RO (1 μM), CQ (40 μM) or RO + CQ (1 μM + 40 μM) (cell image: Fig. S5A) (* p < 0.05). F. Statistics of the P62 puncta number in PANC-1 cells treated with control, RO (1 μM), CQ (40 μM) or RO + CQ (1 μM + 40 μM) (cell image: Fig. S5B) (* p < 0.05). G. Statistics of LC3 puncta number in BxPC-3 cells treated with control, RO (1 μM), CQ (40 μM) or RO + CQ (1 μM + 40 μM) (cell image: Fig. S5C) (* p < 0.05). H. Statistics of P62 puncta number in BxPC-3 cells treated with control, RO (1 μM), CQ (40 μM) or RO + CQ (1 μM + 40 μM) (cell image: Fig. S5D) (* p < 0.05). I. Statistics of cleaved PARP1-positive and cleaved PANC-1-negative cell numbers treated with the control, RO (1 μM), CQ (40 μM) or RO + CQ (1 μM + 40 μM) (cell image: Fig. S5E) (* p < 0.05). J. Statistics of cleaved caspase-3-positive and cleaved caspase-3-negative PANC-1 cell numbers treated with the control, RO (1 μM), CQ (40 μM) or RO + CQ (1 μM + 40 μM) (cell image: Fig. S5F) (* p < 0.05). K. Statistics of cleaved PARP1-positive and cleaved PARP1-negative BxPC-3 cells treated with the control, RO (1 μM), CQ (40 μM) or RO + CQ (1 μM + 40 μM) (cell image: Fig. S5G) (* p < 0.05). L. Statistics of cleaved caspase-3-positive and cleaved caspase-3-negative BxPC-3 cell numbers treated with the control, RO (1 μM), CQ (40 μM) or RO + CQ (1 μM + 40 μM) (cell image: Fig. S5H) (* p < 0.05). M. TEM image of PANC-1 and BxPC-3 cells treated with the control, RO (1 μM), CQ (40 μM) or RO + CQ (1 μM + 40 μM) at 24 h. Autophagy and apoptosis signs were detected. Green arrow: autophagosome. Red arrow: apoptosis sign. Yellow arrow: dysfunctional lysosome. N. Western blotting of PANC-1 and BxPC-3 cells treated with the control, RO (1 μM), CQ (40 μM) or RO + CQ (1 μM + 40 μM) at 24 h. GAPDH was used as a loading control

