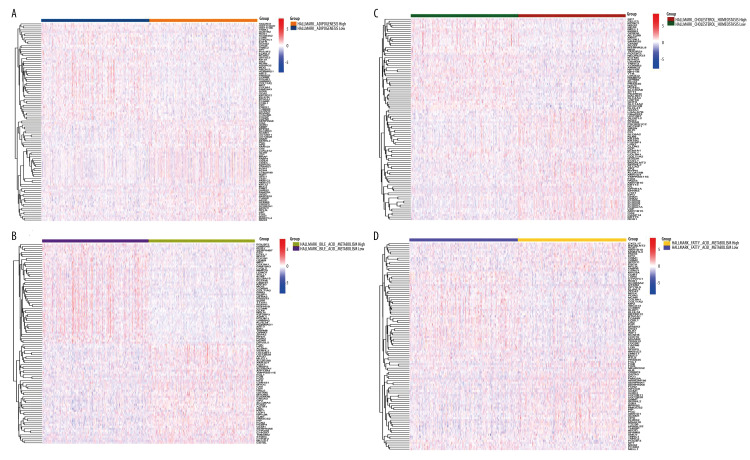
Figure 2.
Four lipid metabolism-related pathways in HALLMARK were used as scoring standards. (A) Using the median value of HALLMARK_CHOLESTEROL_HOMEOSTASIS score as the standard, we performed differential gene expression analysis for the high group and the low group. (B) Using the median value of HALLMARK_ADIPOGENESIS score as the standard, we performed differential gene expression analysis for the high group and the low group. (C) Using the median value of HALLMARK_FATTY_ACID_METABOLISM score as the standard, we performed differential gene expression analysis for the high group and the low group. (D) Using the median value of HALLMARK_BILE_ACID_METABOLISM score as the standard, we performed differential gene expression analysis for the high group and the low group.

