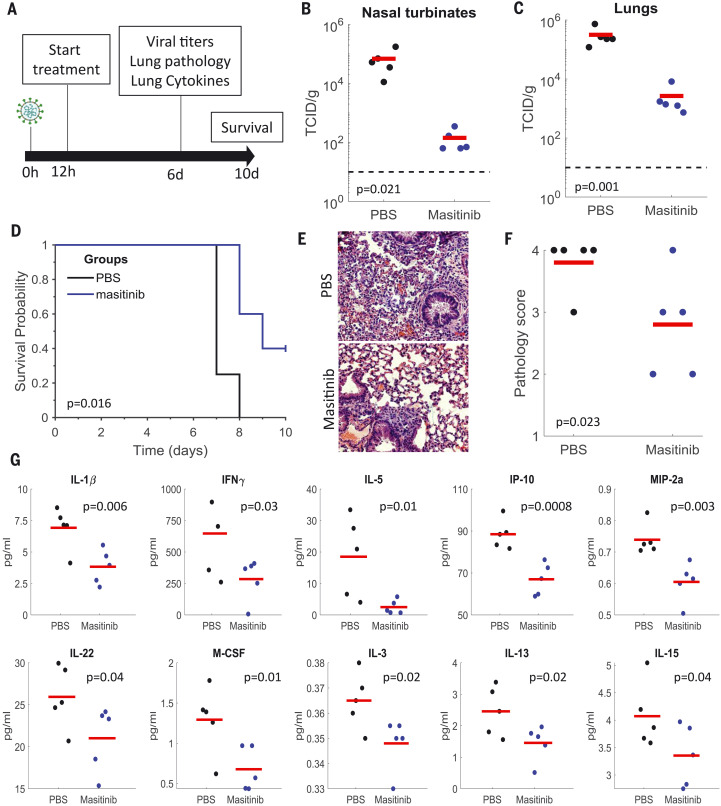
Fig. 4. Masitinib inhibits SARS-CoV-2 replication in mice.
(A) Schematic diagram of the experiment. (B and C) SARS-CoV-2 infectious virus measurements in the nose (B) and lungs (C) of PBS-treated (black) or masitinib-treated (blue) mice at day six after infection. n = 5 mice per group. Red lines are the mean values. The p values are shown in the figure (one-tailed Student’s t test). TCID, tissue culture infectious dose. (D) Kaplan-Meir curves assessing mice survival after PBS (black, n = 4) or masitinib (blue, n = 5) treatment after infection. The p value is shown in the figure (log-rank test). (E) Representative images of lung histology [hematoxylin and eosin (H&E)] stain at 6 days after infection. (F) Lung pathology score on day six after infection. Tissues were blindly scored on a scale of 0 to 4 by an expert veterinarian pathologist. n = 5 mice per group. The red lines are the mean values. The p value is shown in the figure (one-tailed Student’s t test). (G) Cytokine concentrations in the lungs of infected mice treated with PBS (black) or masitinib (blue) at day six after infection. n = 5 mice per group. The red lines are the mean values. The p values are shown in the figure (one-tailed Student’s t test). The experiment was performed once. IP-10, 10-kDa interferon gamma–induced protein; M-CSF, macrophage colony-stimulating factor 1; MIP-2a, macrophage inflammatory protein 2-alpha.

