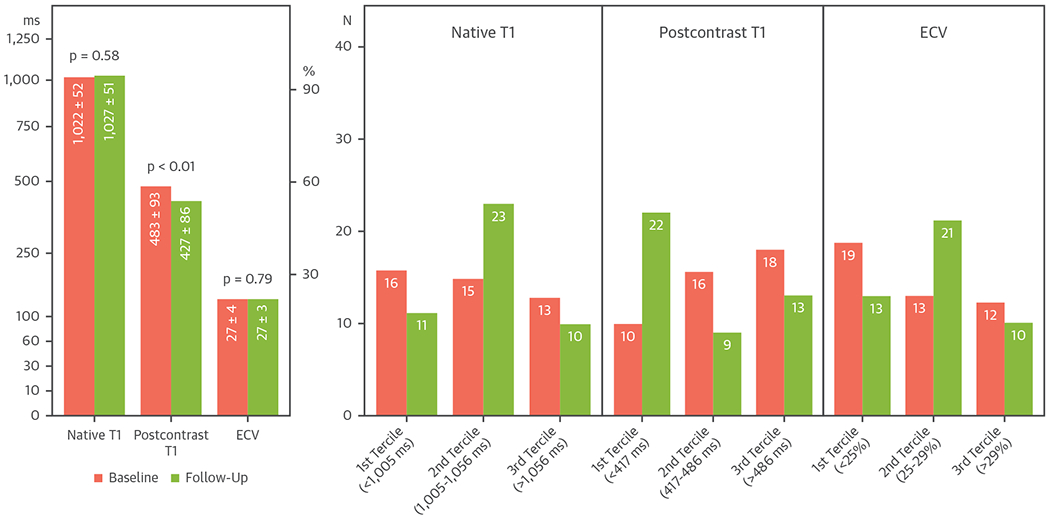
FIGURE 1. Baseline and Follow-Up.

T1-mapping values were shown as mean global native T1, postcontrast T1, and extracellular volume fraction (ECV) in the left panel and as tercile categories in the right panels.

T1-mapping values were shown as mean global native T1, postcontrast T1, and extracellular volume fraction (ECV) in the left panel and as tercile categories in the right panels.