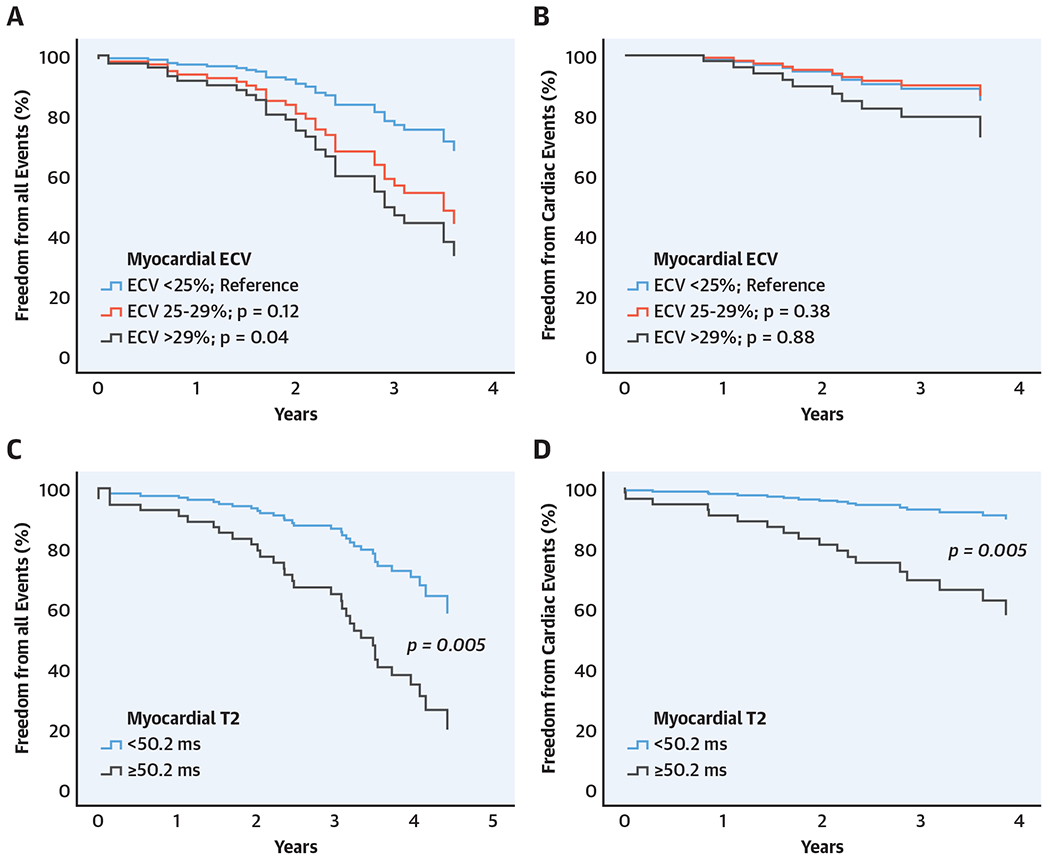
CENTRAL ILLUSTRATION. Survival Curves Categorized by Myocardial ECV and T2 Mapping.

(A) Extracellular volume fraction (ECV) for all clinical events (covariates = left ventricular end systolic volume index [LVESVI], presence of late gadolinium enhancement [LGE]). (B) ECV for cardiac events (unadjusted). (C) T2 mapping for all clinical events (covariates = left ventricular ejection fraction [LVEF], LVESVI, presence of LGE). (D) T2 mapping for cardiac events (covariates = LVEF).
