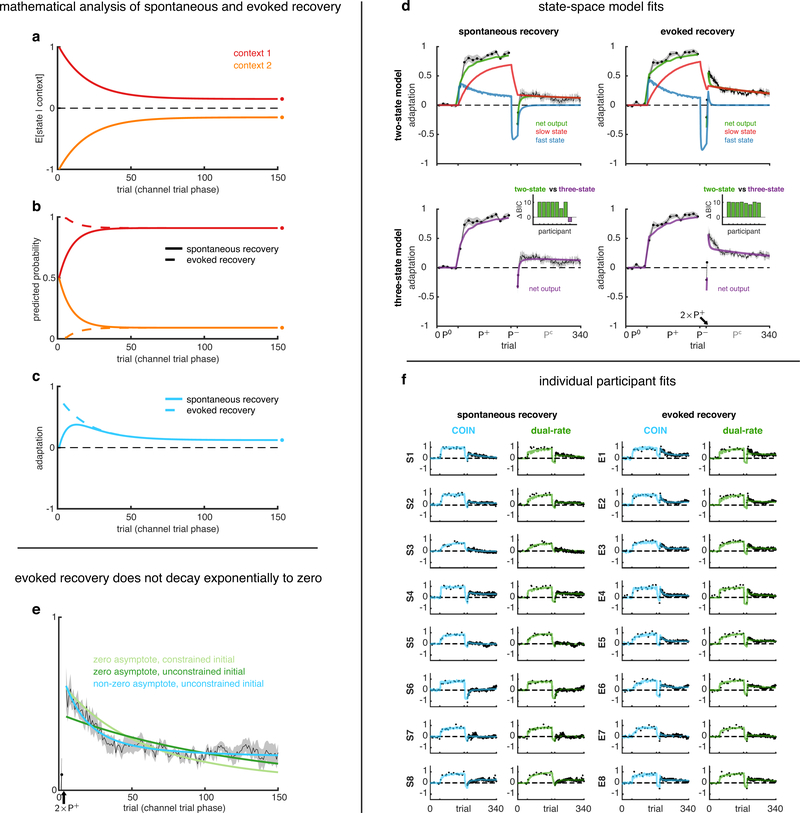
Extended Data Fig. 6 |. Additional analyses of spontaneous and evoked recovery related to Fig. 2. a-c, Mathematical analysis of spontaneous and evoked recovery.
The channel-trial phase of spontaneous and evoked (after the two P+ trials) recovery simulated in a simplified setting (Suppl. Inf.) with two contexts that are initialised to have equal but opposite state estimates (a) and equal (spontaneous recovery, solid) or highly unequal (evoked recovery, dashed) predicted probabilities (b). For the two contexts, the retention parameters are assumed to be constant and equal, and the drift parameters are assumed to be constant, of the same magnitude but opposite sign. Mean adaptation (c), which in the COIN model is the average of the state estimates (a) weighted by the corresponding context probabilities (b), shows the classic pattern of spontaneous recovery (solid, cf. Fig. 2b–c) and the characteristic abrupt rise of evoked recovery (dashed, cf. Fig. 2d–e). Note that although in the full model, state estimates are different between evoked and spontaneous recovery following the two P+ trials, here we assumed they are the same (no separate solid and dashed lines in a) for simplicity and to demonstrate that the difference in mean adaptation between the two paradigms (c) can be accounted for by differences in contextual inference alone (b, cf. Fig. 2b and d, top right insets). Circles on the right show steady-state values of inferences and the adaptation. Note that in both paradigms, adaptation is predicted to decay to a non-zero asymptote (see also e). d, State-space model fits to adaptation data from the spontaneous and evoked recovery groups. Solid lines show the mean fits across participants of the two-state model (5 parameters, top row) and the three-state model (7 parameters, bottom row) to the spontaneous recovery (left column) and evoked recovery (right column) data sets. Mean ± SEM adaptation on channel trials shown in black (same as in Fig. 2c and e). Insets show differences in BIC (nats) between the two-state model and the three-state model for individual participants (positive values in green indicate evidence in favour of the two-state model, and negative values in purple indicate evidence in favour of the three-state model). At the group level, the two-state model was far superior to the three-state model (Δ group-level BIC of 64.2 and 78.4 nats favour of the two-state model for the spontaneous and evoked recovery groups, respectively). Individual states are shown for the two-state model (top, blue and red). Both the fast and slow processes adapt to P+ during the extended initial learning period. The P− phase reverses the state of the fast process, but not of the slow process, so that they cancel when summed resulting in baseline performance. Spontaneous recovery during the Pc phase is then explained by the fast process rapidly decaying, revealing the state of the slow process that has remained partially adapted to P+. Note that this explanation is because in multi-rate models all processes contribute equally to the motor output at all times. This is fundamentally different from the expression and updating of multiple context-specific memories in the COIN model, which are dynamically modulated over time according to ongoing contextual inference. e, Evoked recovery does not decay exponentially to zero. According to the COIN model, adaptation in the channel-trial phase of evoked recovery can be approximated by exponential decay to a non-zero (i.e. positive) asymptote (a-c, Fig. 2e, Suppl. Inf.). To test this prediction, we fit an exponential function that either decays to zero (light and dark green) or decays to a non-zero (constrained to be positive) asymptote (cyan) to the adaptation data of individual participants in the evoked recovery group after the two P+ trials (black arrow). The two zero-asymptote models differ in terms of whether they are constrained to pass through the datum on the first (channel) trial (light green) or not (dark green). The mean fits across participants for the models that decay to zero (green) fail to track the mean adaptation (black, ± SEM across participants), which shows an initial period of decay followed by a period of little or no decay. The mean fit for the model that decays to a non-zero asymptote (cyan) tracks the mean adaptation well and was strongly favoured in model comparison (Δ group-level BIC of 944.3 and 437.7 nats compared to the zero-asymptote fits with constrained and unconstrained initial values, respectively). Note that fitting to individual participants excludes the confound of finding a more complex time course (e.g. one with non-zero asymptote) only due to averaging across participants that each show a different simple time course (e.g. all with zero asymptote but different time constants). f, COIN and dual-rate model fits for individual participants in the spontaneous and evoked recovery groups. Data and model predictions are shown for individual participants as in Fig. 2c and e for across-participant averages. Participants in the S and E groups are ordered by decreasing BIC difference between the dual-rate and COIN model (i.e. S1’s and E1’s data most favour the COIN model), as in insets of Fig. 2c and e. Note that the COIN model can account for much of the heterogeneity of spontaneous (e.g. from large in S1 to minimal in S6) and evoked recovery (e.g. from large in E1 to minimal in E7).

