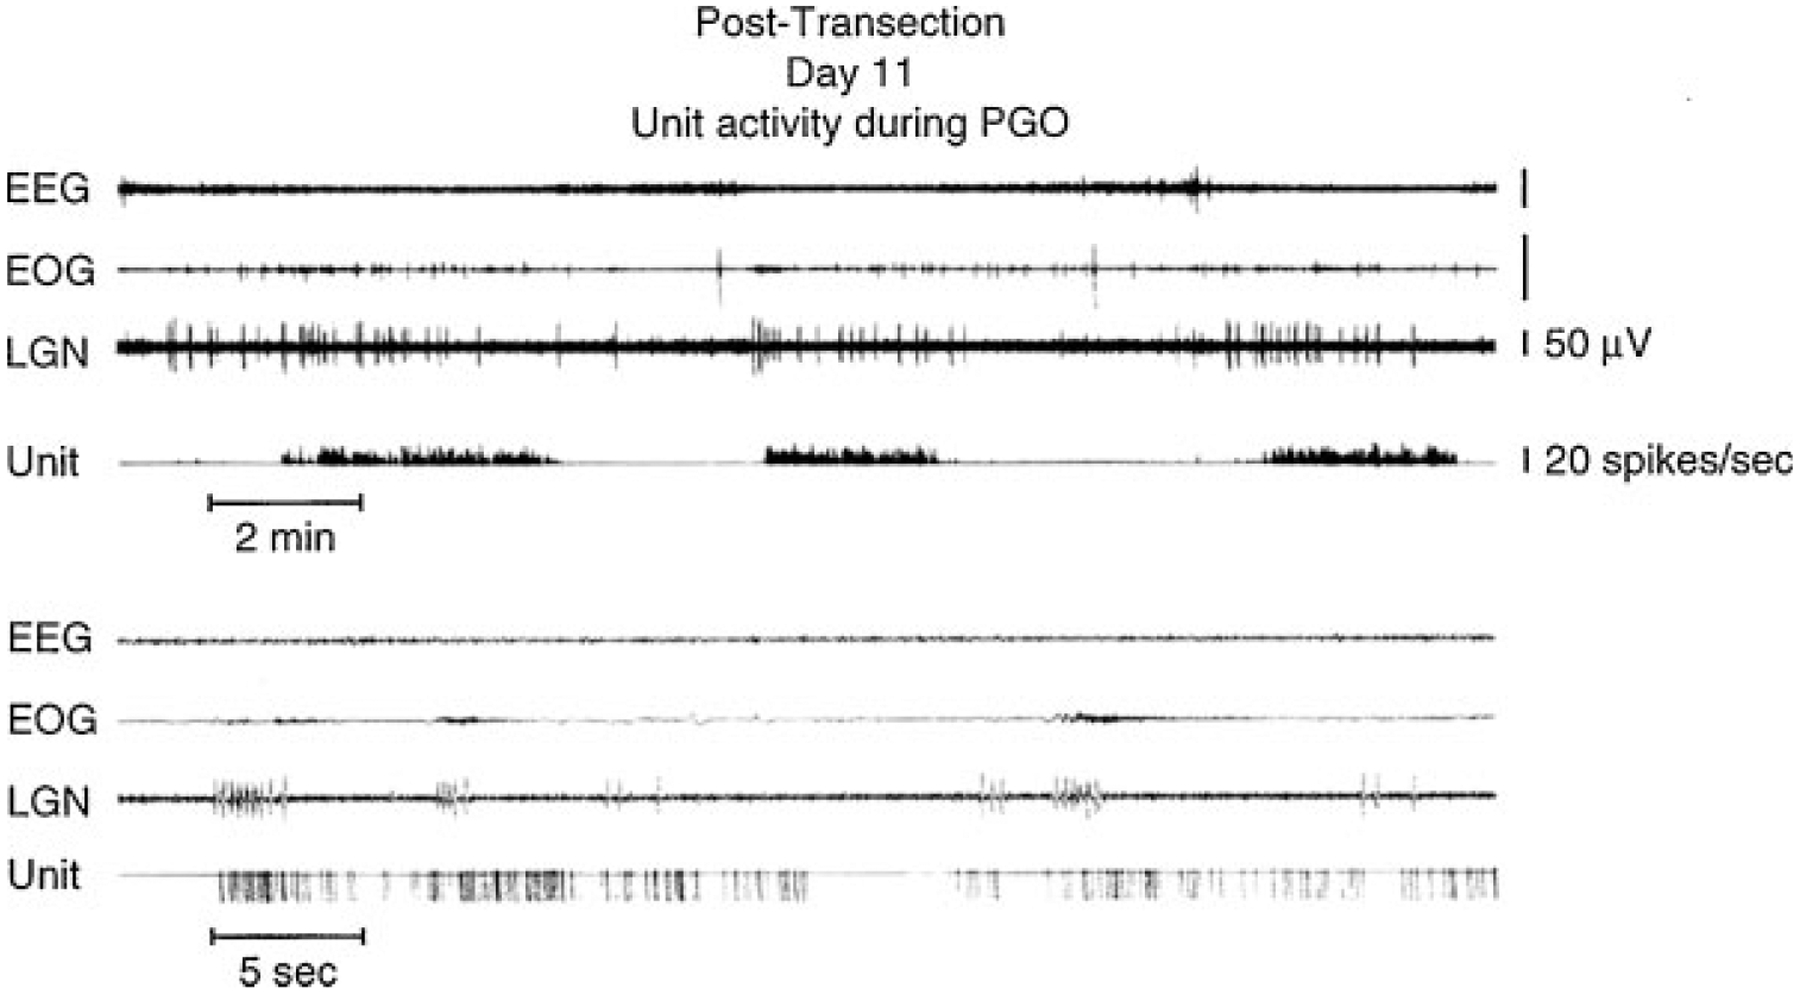
Figure 5.

Midbrain unit: electroencephalographic (EEG), electro-oculographic (EOG), and lateral geniculate nucleus (LGN) activity rostral to chronic transections at the pontomedullary junction. In the upper portion of the figure, the unit channel displays the output of an integrating digital counter resetting at 1-second intervals. In the lower portion, one pulse is produced for each spike by a window discriminator. (From Siegel.51)
