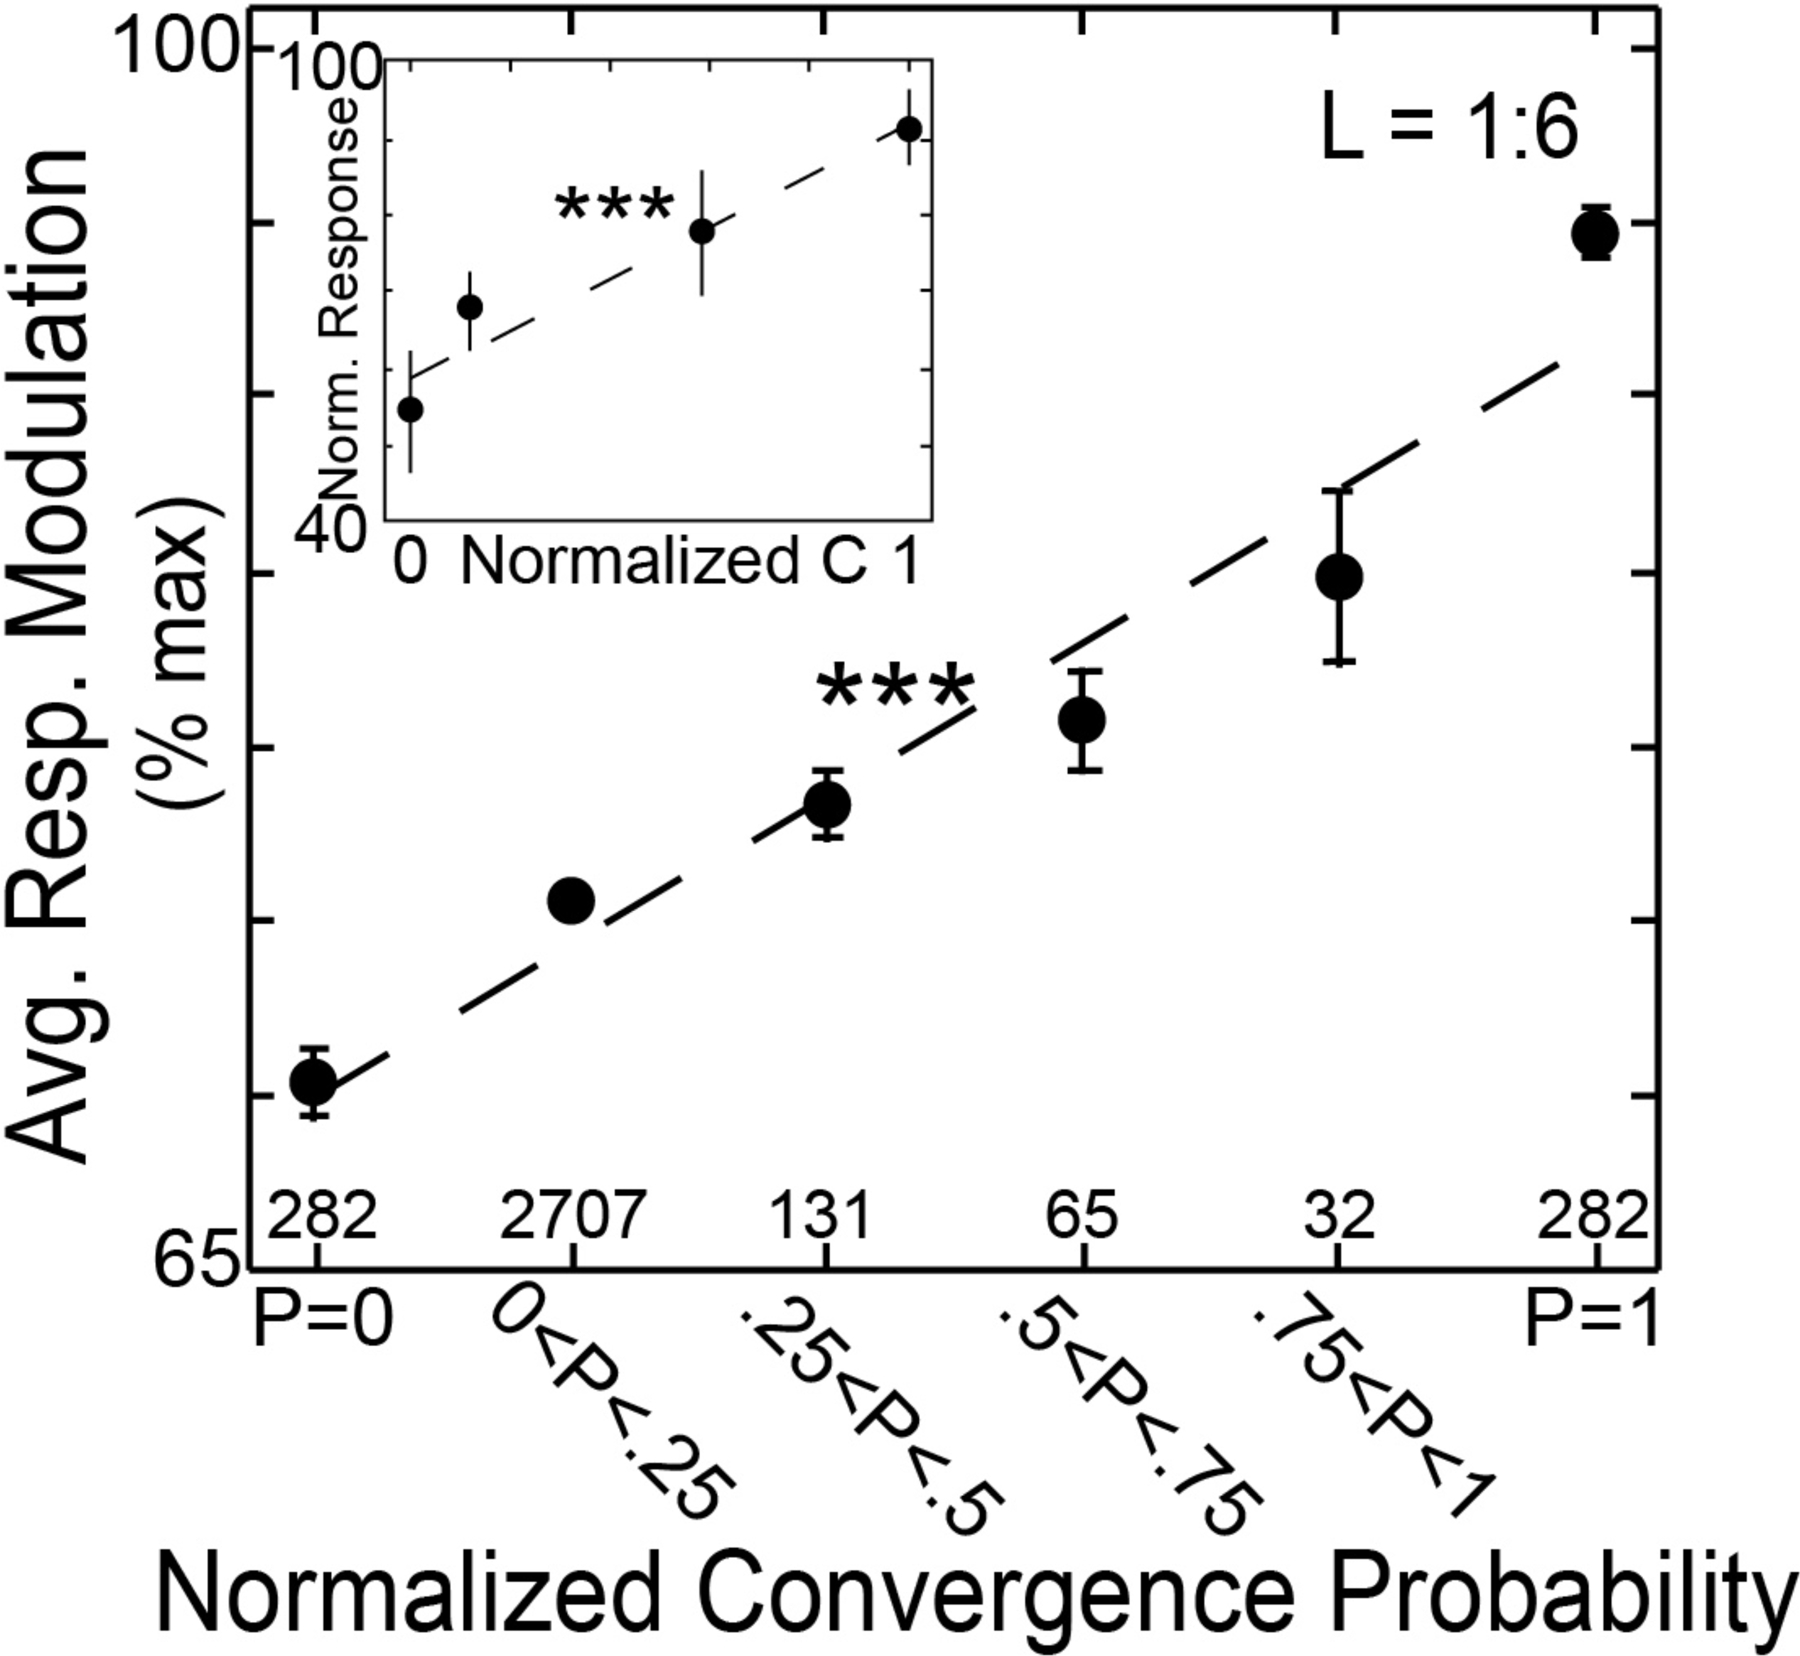
Figure 5.

Representation of retrospective transition probability in a songbird brain: The y-axis measures the response modulation of neurons in area HVC of the Bengalese finch to a syllable (Bouchard and Brainard, 2013). The x-axis measures the retrospective transition probability from that syllable to the preceding sequence in the natural song of the bird. An increase in retrospective transition probability to the preceding stimulus causes a linear increase in response of HVC neurons. Reproduced here with permission (Fig 4G in original publication).
