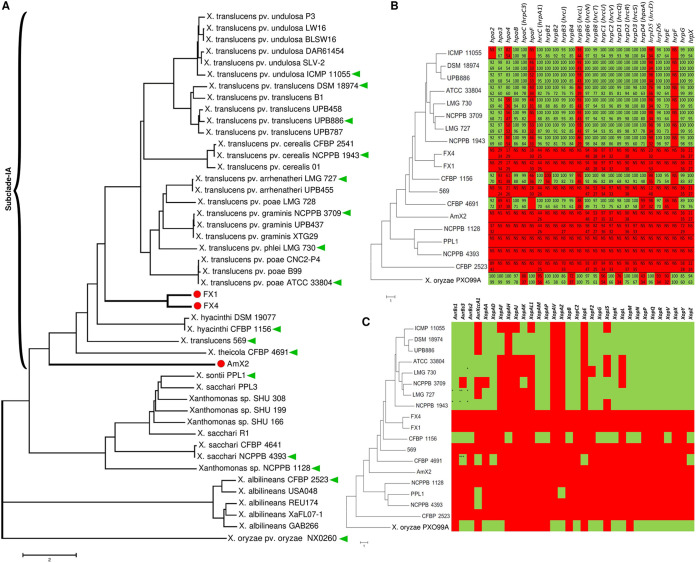
FIG 3.
Average nucleotide identity (ANI)-based neighbor-joining distance clustering tree of all available clade I Xanthomonas strains constructed using the ANI/AAI-Matrix genome-based distance matrix calculator (A). The clade I xanthomonads were divided into two subclades (9), where strains FX1, FX4, and AmX2, which were sequenced in this study, were clustered in subclade IA. Predicted type III secretion system (T3SS) (B) proteins and Xanthomonas outer proteins (Xops or non-TALEs) (C) in the three Xanthomonas strains sequenced in this study were compared to a representative set of clade I Xanthomonas genomes retrieved from the NCBI GenBank. (A) Red circles indicate the three strains sequenced in this study; green triangles indicate the strains included in the comparative genomics analyses. (B and C) Green and red squares indicate the presence and absence of the respective genes, respectively, while the numbers inside the squares (B) indicate the query coverage (top numbers) and sequence similarity (bottom numbers) indices in the BLASTp search. NS, no significant similarity was found in BLASTp.

