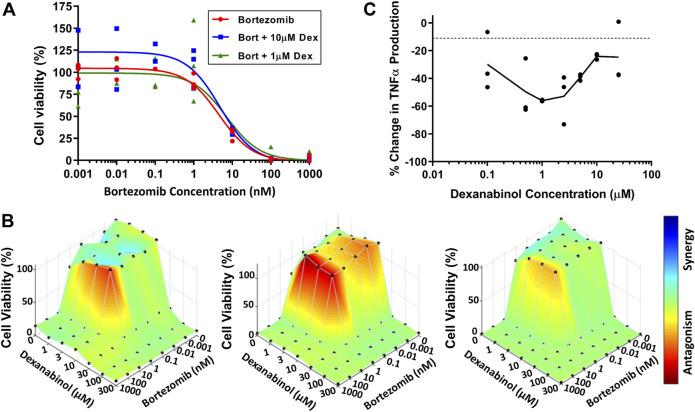
FIGURE 2.
Assessment of in vitro cytotoxicity of bortezomib and dexanabinol. Cell viability was measured using WST-1. (A) Cytotoxicity of SH-SY5Y cells exposed to various concentrations of bortezomib in the absence (red) or presence of 1 μM (green) and 10 μM (blue) dexanabinol. (B) Cytotoxicity of U266 multiple myeloma cells exposed to a range of bortezomib and dexanabinol concentrations for (left) 24, (middle) 48, and (right) 72 h. Antagonistic, additive, and synergistic pharmacological relationships are colored in red, green, and blue. (C) Concentration-effect relationship of dexanabinol on LPS-induced TNFα production in primary rat macrophages.

