FIGURE 7.
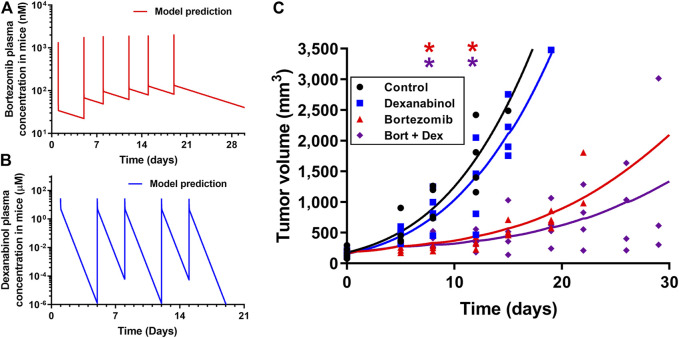
Pharmacokinetics and pharmacodynamics of dexanabinol and bortezomib in a MM1.S multiple myeloma mouse model. Model predicted mouse plasma concentrations of (A) 1 mg/kg of bortezomib administered on Days 1, 5, 8, 12, 15, and 19 and (B) 10 mg/kg of dexanabinol administered on Days 1, 5, 8, 12, and 15. (C) Pharmacodynamics of bortezomib and dexanabinol on MM1.S tumor volume in SCID mice. Tumors were grown to approximately 100 mm3 prior to drug administration. Mice (n = 20) were divided into four treatment groups: treatment naïve (black), dexanabinol (blue), bortezomib (red), and their combination (purple). Bortezomib and dexanabinol were administered IP twice weekly (1 and 10 mg/kg). Tumor volume measurements and pharmacodynamic model fitted profiles are displayed as solid markers and dashed lines. Asterisks indicate statistical significance from control (corrected p value < 0.5), which were obtained via multiple t-tests with Holm-Sidak Bonferroni correction (GraphPad Prism v7.04).

