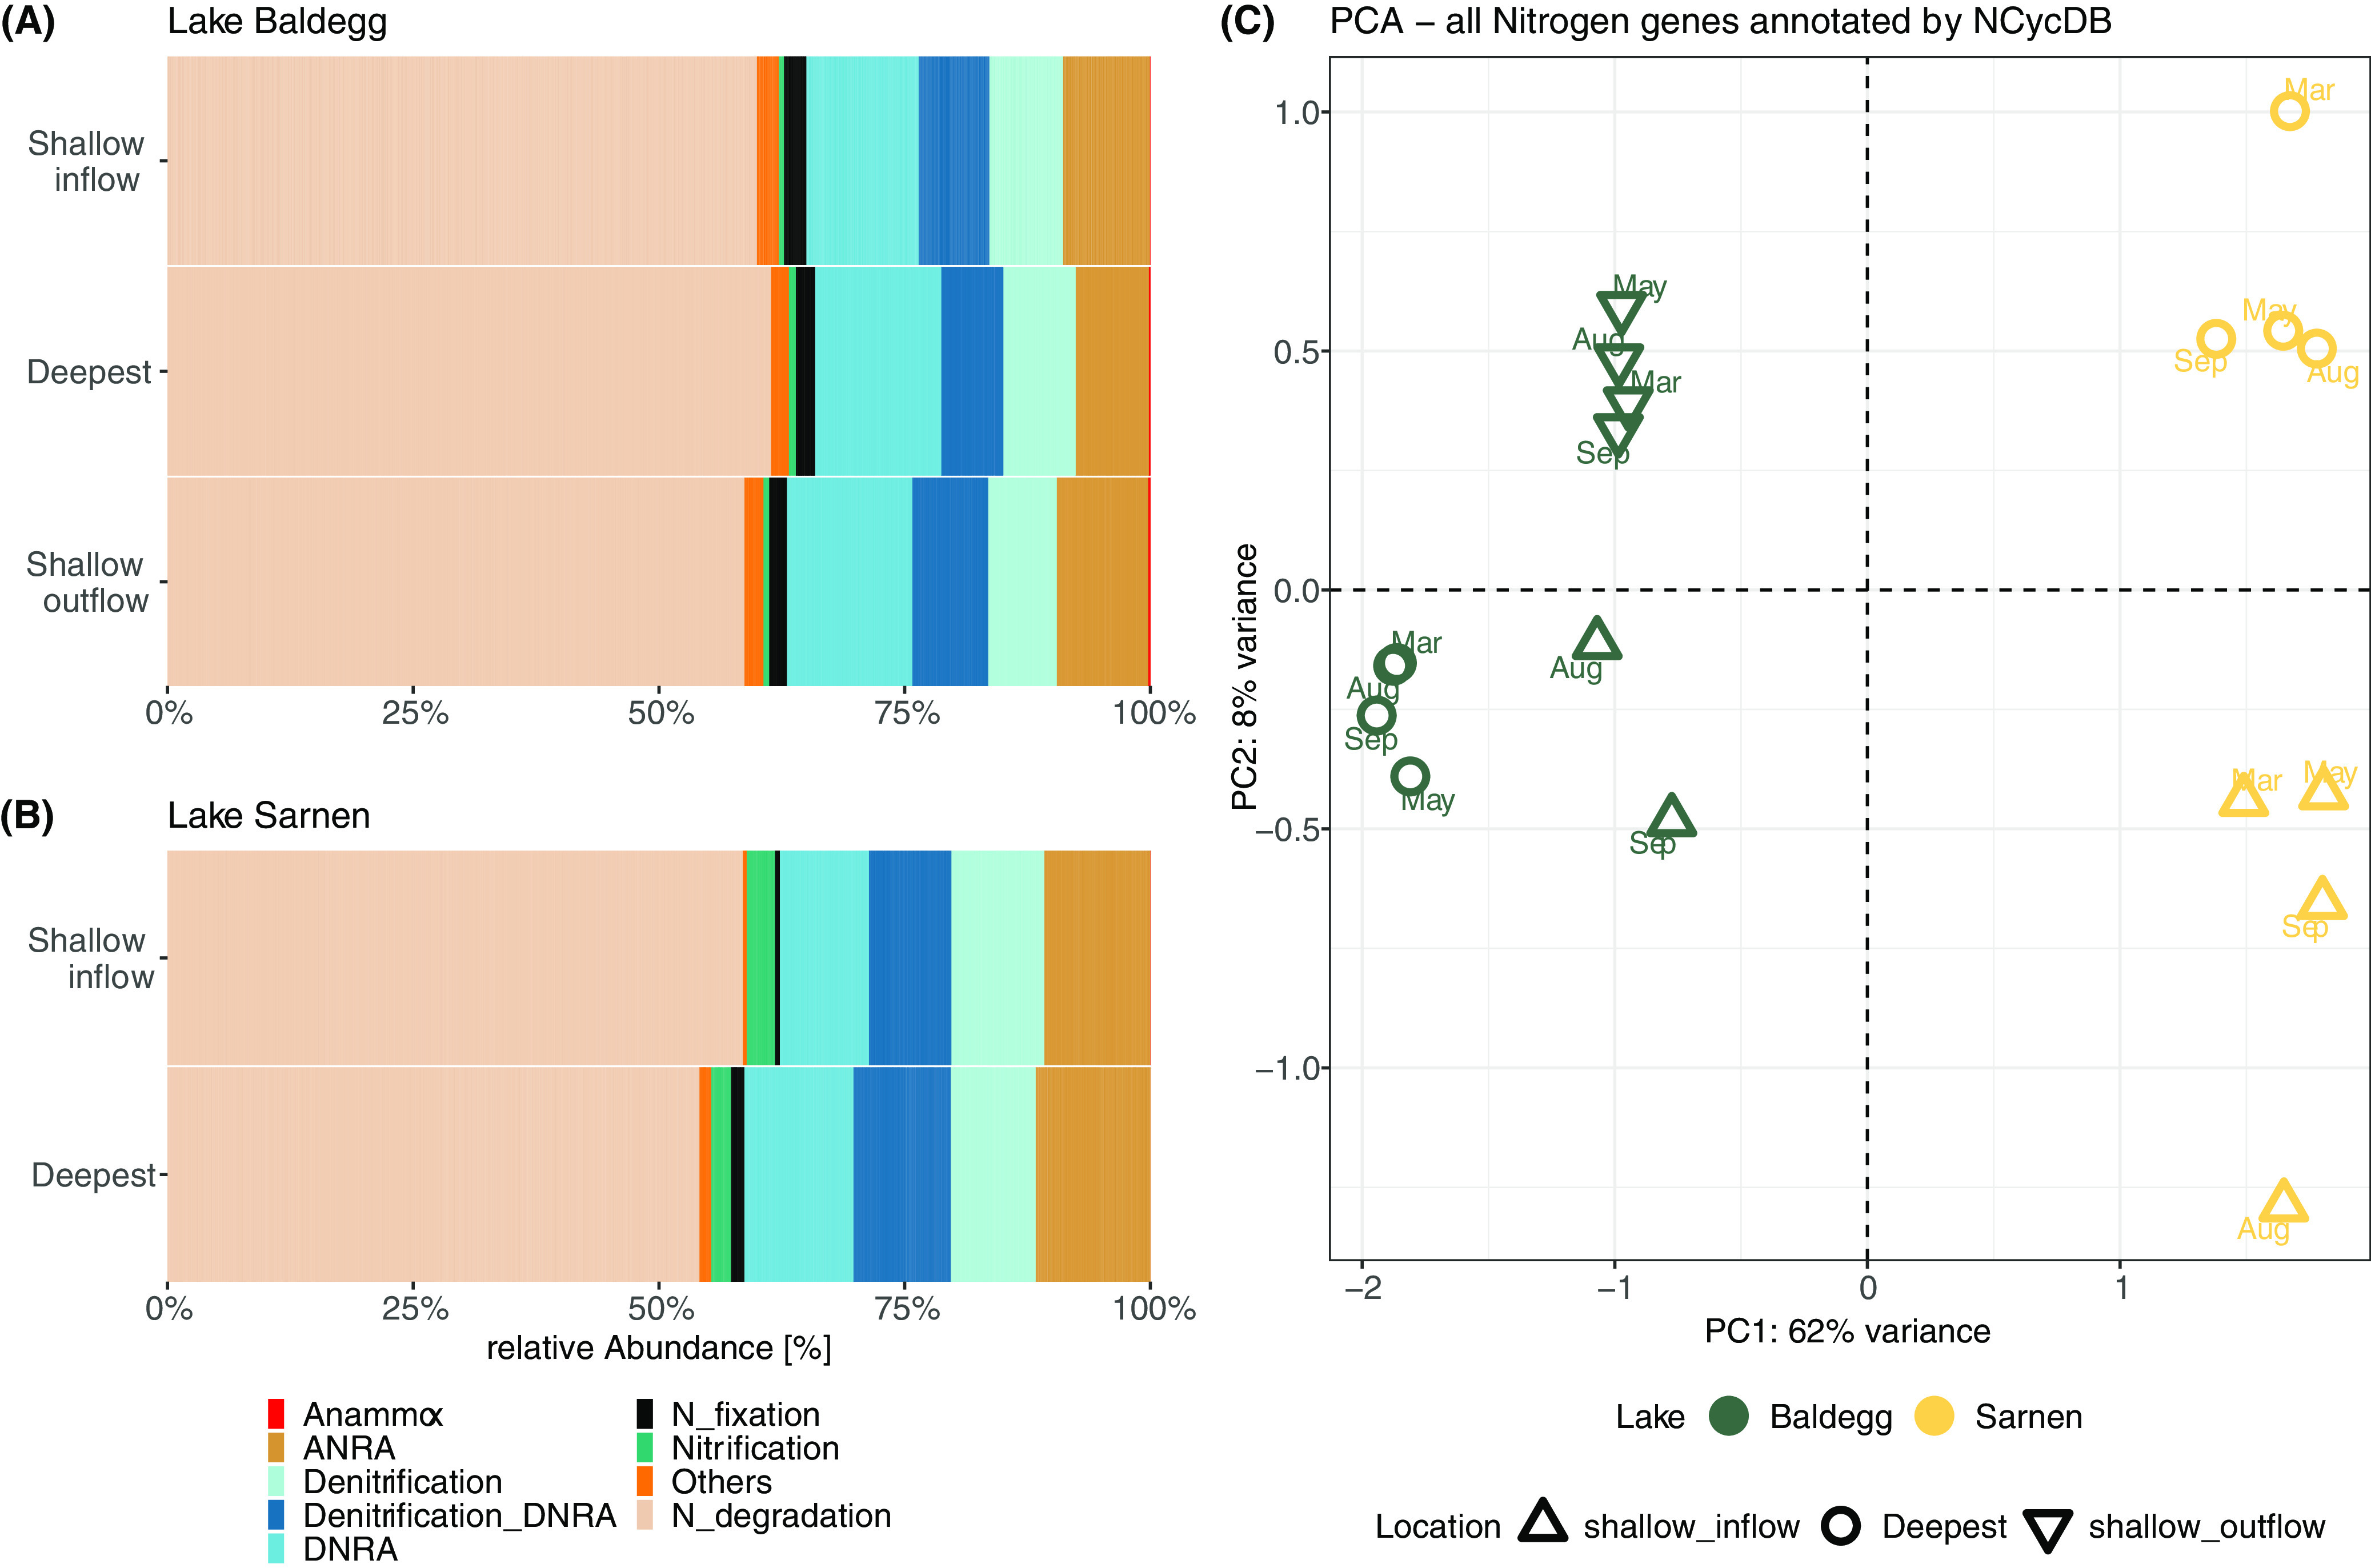
FIG 5.

Nitrogen transformation gene distribution in Lake Baldegg (A) and Lake Sarnen (B) for each station summed over all seasons, grouped by the nitrogen transformation processes (Table 2). Nitrate reduction genes that cannot be assigned to either denitrification or DNRA are grouped together (Denitrification_DNRA). (C) The principal component analysis shows the nitrogen gene counts for each station, calculated with the DESeq2 package.
